30 Weird, Fascinating, And Disturbing Statistics About Pretty Much Everything (New Answers)
Ah, statistics. In high school, that was one of the most dreaded classes everyone tried hard to avoid. Despite how useful the course was, it just didn’t appeal to our picky teenage taste. Thankfully, as I’ve gotten older, I’ve learned to really appreciate statistics for how much they teach us about our world. Clearly, I’m not alone either.
Earlier this week, Reddit user Foundation_james reached out asking for the most interesting statistics people know, and the post received thousands of responses. We’ve gathered some of the most fascinating statistics people shared, so you can read them below and add them to your list of go-to fun facts. Be sure to upvote all of your favorite stats, and then if you’re looking to learn even more from Bored Panda, we recommend checking out this piece next.
This post may include affiliate links.
 Of the 30 fastest 100 meter sprint times, 21 were run by athletes who tested positive for performance enhancing drugs.
The other 9 were Usain Bolt.
Statistics are more prevalent in our day to day lives than many of us even realize. Every time we check the weather before deciding what to wear in the morning, we’re relying on statistics. When our insurance company informs us of the rates we’re going to be charged, they’ve determined those numbers based on stats of all the drivers and homeowners in our area. When a friend offers us a cigarette at a party, we may politely decline because it’s hard to ignore the statistics about cancer rates linked to smoking.
The field of statistics is the science of learning from data, and without an understanding of it, we would have a very difficult time making decisions. When preparing for emergencies, for example, we can assess the risks based on statistics. How often do hurricanes occur in this area? How likely is one to occur within the next week? When a hurricane does hit, how devastating is it expected to be? The National Hurricane Center uses various statistical models "based on historical relationships between hurricane-specific information, such as the location and time of year, and the behavior of historical hurricanes" to predict future storms. These stats are incredibly important in keeping citizens safe and minimizing destruction from hurricanes.
 There have been 288 mass shootings at schools since 2009 in the USA. The country with the next highest amount has………….. 8. To be clear they have 2.7% of the mass shootings at school that we do.
Which does not count Pulse in Orlando, the Vegas Strip shooting, etc.
 34 percent of adults and 75 percent of children sleep with a stuffed animal or a blanket, or other sentimental object as their comfort object.
Statistics also play a huge role in political campaigns. We can predict the outcome of elections by using data about an area from past elections and by polling individuals during a campaign to see where they are leaning. Politicians running for office use this data to decide where to focus their energy as well. If a county has voted Republican in every presidential election for the past 20 years, they are likely to vote the same way in the future, regardless of how many rallies are held there.
Statistics have also been incredibly important to governments in combating the Covid-19 pandemic. Decisions about lockdowns, restrictions, mask mandates and vaccine requirements have all been made based on illness and death rates over time. It would have been very difficult for governments to determine a course of action in fighting Covid without proof of how it’s spreading and where.
 Despite making up less than 4% of the population, Americans produce over 20% of the garbage in the world.
 Less than 10% of Americans do not wear seatbelts and account for 51% of car related fatalities.
Wear your seatbelt. Ignore your friend who told you "My buddy's cousin would've died if he was wearing his seatbelt!"
 48% of British people wouldn’t go to space even if their safety was guaranteed with the most popular reason being that they just simply didn’t have any interest in going
Statistics also benefit us when we’re doing our weekly grocery shop. Stores use the data they collect on what products are being purchased the most frequently to decide how much to order. This is particularly important for items that become more popular in specific seasons, such as sunscreen in the summer months and hot chocolate in the winter. And if you want to determine the best time to go grocery shopping to avoid crowds, the stats will tell you to go on Mondays and Tuesdays. Skip shopping on Saturdays and Sundays, especially between 11am-12pm, as shoppers spend an average of 7 more minutes in stores on weekends due to crowds.
 Dragonflies have a 95% hunt success rate. Making them the most effective hunters in the world.
 93% of people don't check facts they read on the internet.
 67% of statistics are made up
Statistics can also be exciting when learning about topics we’re passionate about, like sports. Data analytics have become extremely important in the world of professional sports for team strategies and for the enjoyment of fans. It wasn’t until 2002, however, that sports analytics really started to take off. The catalyst was Billy Beane, who was general manager of the Oakland Athletics at the time, using statistical analysis to curate a powerful team of lesser-known baseball players. After the Athletics almost won the World Series, Beane’s strategy, which came to be known as “Moneyball”, quickly became the norm for other teams as well and even inspired a 2011 film starring Brad Pitt.
According to a report from Research and Markets, the global sports analytics industry is expected to reach $3.4 billion by 2028. Part of the reason for this is the speed at which analytics technology has evolved. Companies like Genius Sports, for example, are able to “generate statistical breakdowns from video footage to help coaches optimize their play calling during games or generate post-game takeaways”. Cameras are also used by many companies to track player movement, ball speeds and more. But it’s not only the teams who benefit from this data. Fans use these statistics to create their fantasy league teams and place bets on who will win games.
 20% of the mammal species on our planet are different types of bats.
There's about 5000 species of mammals, and about 1000 of them are varieties of our little winged buddies.
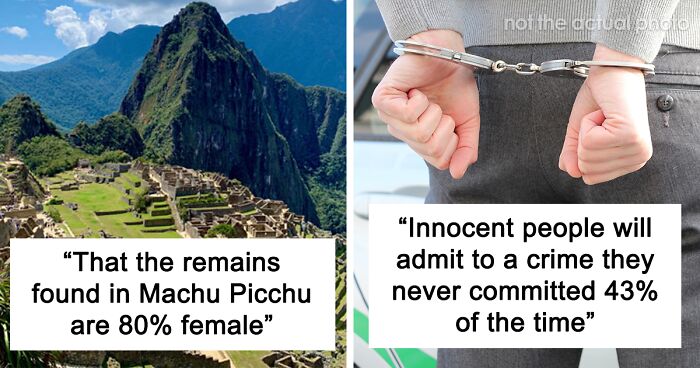
 That the remains found in Machu Picchu are 80% female.
 Brazil is the country that kills the most trans women per year.
Brazil is also the country where the porn category with the most viewers is the one with trans women.
No matter what your favorite sport is, I’m sure you can find a high-tech analytics company that’s pumping out fascinating data about your favorite athletes. For example, Trace in Austin, Texas, uses recording gear and an AI system to analyze film from soccer games, so coaches and players don’t have to. Players wear tracking devices that record their games, and an AI bot stitches together clips of all of the most important moments. Trace also notes performance metrics including minutes played, distance ran, top speed, max efforts, and stamina, and creates a heat map tracking where players spent most of their time during a game. Technology like this saves coaches time and helps them create more effective strategies for future games.
 Survey of Fortune 500 executives found that 93% agree the golf reflects life.
86% admit to cheating at golf.
 There are more privately owned guns than people in the U.S. (Washington Post June 19, 2018)
 That belly button bacteria study was wild. 60 belly buttons sampled. 2368 different species of bacteria found. The study indicated that 1458 of them may be new to science. One had a rare bacteria found in Japanese soil and they had never been to Japan. Two had rare bacteria that thrived on ice caps and thermal vents. Not a single bacteria was common to all buttons.
I read that the composition of bacteria found in a belly button is as unique as a fingerprint.
When it comes to statistical analysis, there are 7 key types: descriptive, inferential, predictive, prescriptive, exploratory, causal and mechanistic. Each type serves a slightly different purpose, but they all help the world go round. Descriptive statistics, for example, deal with “organizing and summarizing data using numbers and graphs”. Using visual aids like graphs and tables is an efficient way to convey information because it's more palatable for the general population. These are often used in news articles to simplify complex data. As the name suggests, inferential statistics allow us to infer generalizations about data and “make conclusions with respect to future outcomes” by testing hypotheses. This method often uses the sampling theory, various tests of significance and statistical control.
 The leading cause of death for ages 5 to 18 (correction 1 through 18) has recently switched from car crashes to gun violence in the US.
Your school age child is more likely to die from gun violence than any other cause, including car crashes. 21% gun violence, 20% car crashes.
(Edit: Seeing as rates of gun violence for 1 to 4 year olds is exceedingly low (accidental deaths are a different category), the picture for 5 to 18 year olds is likely higher than 21%)
 70% of the german population believe that their ancestors during WW2 helped jewish escapees or didn't support/partake in the actions performed by the nazis.
 There are more Panda Express restaurants than actual Pandas
Predictive analysis is also pretty self-explanatory, as it is used to make predictions about future events based on “current and past facts and figures". We rely on predictive analysis for weather forecasts, and many businesses including marketing companies, insurance companies, financial corporations and online service providers use predictive analysis to gain competitive advantages. Conversely, prescriptive analysis uses data to determine the best reaction to a situation. It relies on several techniques including simulation, graph analysis, algorithms, complex event processing and more.
 You have far more chances to die from a a coconut fall than by a shark attack
 A full 6 percent of Americans reckon they could beat a grizzly bear in unarmed combat.
Edit: And before another bear arm joke, just fyi bears already don’t have arms. So removing bear arms doesn’t improve your chances. Technically, all four are legs, with the front two called forelegs.
Exploratory analysis is generally “the first step of the data analysis process that is conducted prior to any other statistical analysis techniques”. It is not the sole method for predicting or drawing conclusions, but it provides a preview of data and can give valuable insight. Causal analysis is used to understand the reason behind why events occur. For example, it can be used by businesses to trace what went wrong in a failed experiment or by IT companies to check the quality assurance of their software. Lastly, mechanistic analysis is the least common type and is used to “understand the definite changes that could make changes in other variables”. For example, it is used in biological sciences "when studying and inspecting how various parts of the virus are affected by making changes in medicine".
 There are 1.9 popes per square mile in the Vatican City
Vatican City is 0.19 sq mi, so as per the fact stated above , there are supposed to be 0.361 popes, so random statistics doesn't mean to be true always.
 The Birthday Paradox:
It only takes 23 people in the same room for there to be a 50% chance two of them share the same birthday.
Difference between a million and a billion. When put in perspective by units of time, one million seconds is 12 days, one billion seconds is 31 years.
I hope this list is showing you how interesting random statistics about our world can be. I'm thankful for all of the curious statisticians who did the work to figure out these facts and all of the Reddit users who were able to share them with us. Don't forget to upvote all of your favorites, and then let us know in the comments what the most interesting statistic you know is!
 If you made $295,000 every single day since the birth of Christ, you still wouldn't be worth what Elon Musk is.
Edit: Let's put the same concept into seconds. If you were to do a conversion of dollars to seconds ($1 = 1 second), the median American gets 1 day and 10 hours (net worth of $121,760).
Elon musk would get 6,910 YEARS.
 The human eye blinks about 4.2 million times a year on average
 The job with the highest death rate historically in the US is President
Edit: I didn’t factor in lifetime appointments, so technically I was wrong if you count that
Some of these stats felt really fake, and not just the ones that said things like “67% of statistics are made up on the spot” EDIT: now that I think about it, maybe that stat is true
im so over being a part of a world that now says unalived because the word dead is so....what? scary? offensive? wtf is wrong with people!!!
Whew! Rough day at work, today. I'm unalive tired.
Load More Replies...Some of these stats felt really fake, and not just the ones that said things like “67% of statistics are made up on the spot” EDIT: now that I think about it, maybe that stat is true
im so over being a part of a world that now says unalived because the word dead is so....what? scary? offensive? wtf is wrong with people!!!
Whew! Rough day at work, today. I'm unalive tired.
Load More Replies...
 Dark Mode

 No fees, cancel anytime


