“85% Of Women Wear The Wrong Bra Size”: 50 Wild Statistics That Are As Random As They Are Interesting, As Shared On This Twitter Page
InterviewIf someone asked you if you love math, your response might not be too enthusiastic. But if someone asked you if you’d like to learn interesting facts about the world and all of the people in it, you might be a little more inclined to say yes. As boring as the word ‘statistics’ may sound, as it may trigger you to think about a snooze-fest of a class you took in high school that you barely made it out of with a passing grade, stats can be pretty exciting.
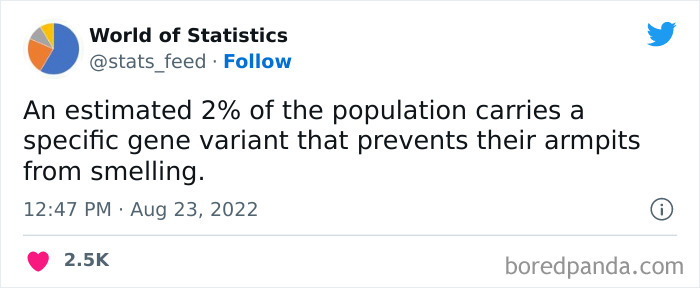
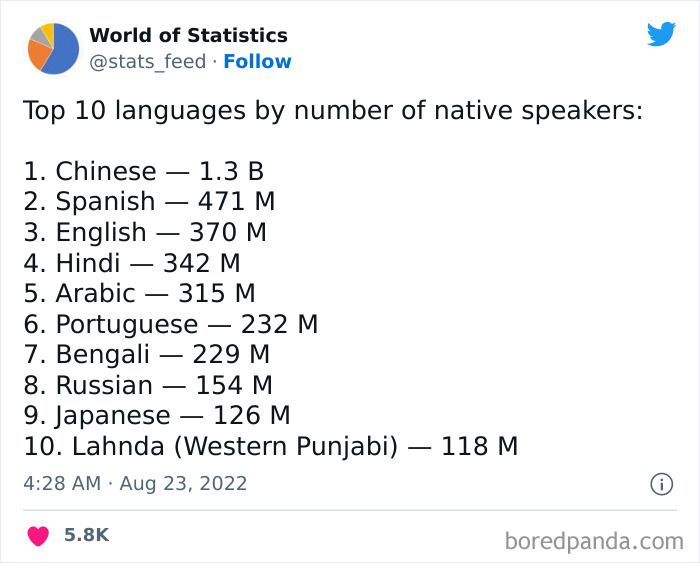
To teach you pandas a little bit more about our amazing planet and all of the people inhabiting it, we did a deep dive into the World of Statistics Twitter account. Whether you’re curious about the most commonly spoken languages in the world or what percentage of the population is incapable of getting smelly armpits, World of Statistics has got you covered.
Below, you’ll find our personal favorite fascinating stats from the page that we think you’ll enjoy too, as well as interviews with Denis, the creator of World of Statistics, and Tim Macuga, Senior Project Officer for the Australian Data Science Network and part of the team behind The Random Sample podcast. So be sure to upvote the statistics that blow your mind, and then let us know in the comments what the most interesting stat you’ve ever heard was. And if you’re interested in learning even more fun facts after finishing this article, you can check out another Bored Panda list featuring statistics you might not know right here.
This post may include affiliate links.
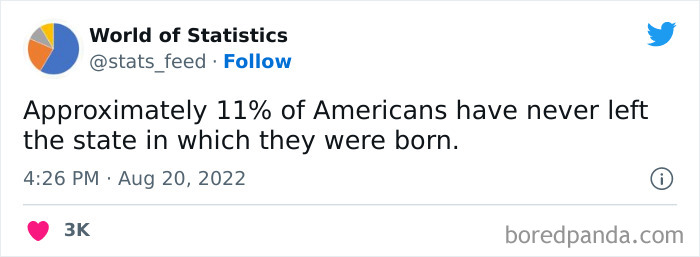
World of Statistics is an extremely successful page. It was initially launched in December 2020, and it has already amassed over 838k followers. The page's bio quotes the late Mark Twain saying, “There are three kinds of lies: lies, damned lies, and statistics.” But along with the sense of humor the creator sometimes showcases on the page, followers certainly can learn a thing or two. For example, did you know that about 11% of Americans have never left the state that they were born in? If you happen to be one of those people, it might be time to start planning a road trip!
It’s not surprising that this page has grown such a massive following though. Learning more about our world is always fun, and it can be great to have a break from the memes and jokes on Twitter to actually gain some knowledge. There is nothing wrong with discussing comedy content you find online with your friends, but at your next dinner party or work gathering, it might be more fitting to bring up some of the eye-opening stats you’ve learned from World of Statistics.
To gain some insight on the background of the page, we reached out the creator of World of Statistics, Denis. "World of Statistics was launched as an addition to our main account - World of Engineering," Denis told Bored Panda. "On the WoE page, I often posted various statistics on engineering topics and saw that it had a very good response from the audience. People love statistics. And since the topics for statistics are endless, it was decided to make a separate account, which began to develop rapidly."
When asked why people find statistics so fascinating, Denis told us, "Statistics are important because today we live in the information world. Literally in one tweet you see enough information to assess the state of any issue in the world. There are countries often compared with each other, and of course, followers are always happy to see their countries in the top."
We also asked Denis to share the most fascinating stat that he knows, and he told us, with a smile, that 69.420% of statistics are made up. Yeah, I'm going to have to have that one fact-checked...
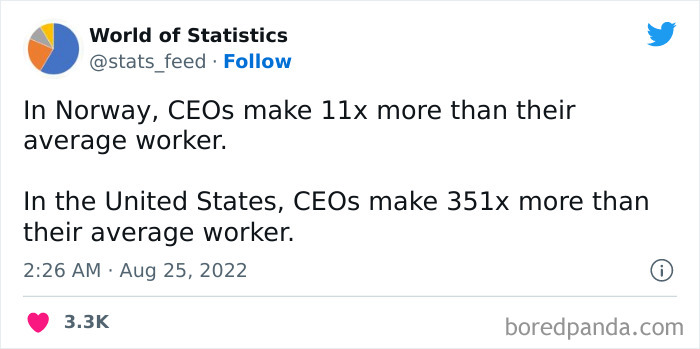
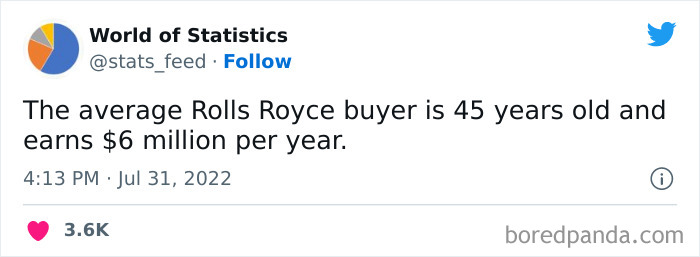
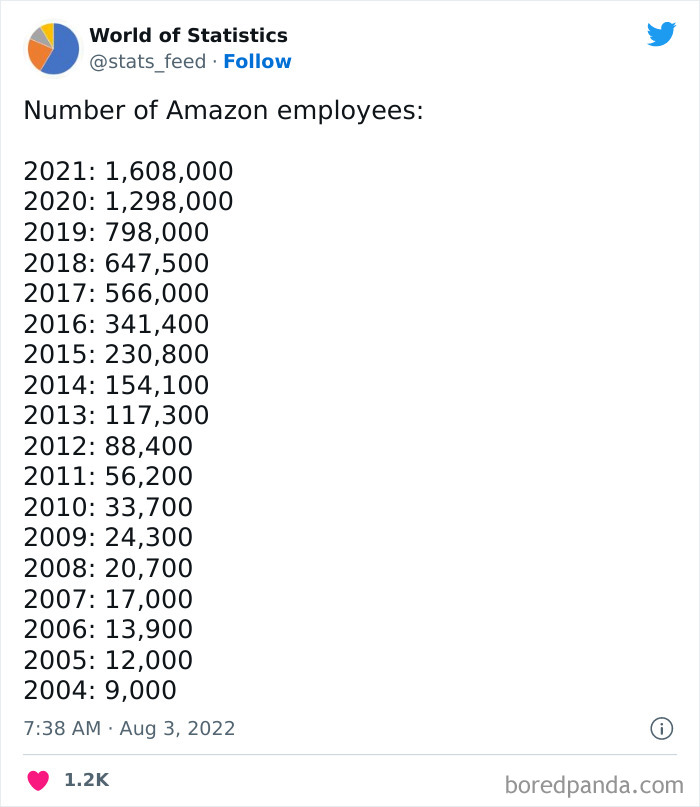
Stuff like this should make every US citizen realize that we are no longer the "Land of the Free". We are all wage slave workers. Indentured servants to our wealthy, who don't pay taxes.
We also reached out to Tim Macuga for some insight on the topic of statistics, as he was one of the team members behind creating The Random Sample podcast, which provides a unique glimpse into the world of mathematics and statistics, and how these sciences play such a crucial role in so many areas of our lives. "The world is literally swimming in data," Tim told Bored Panda. "More than ever, we need people who understand how to work with data and who have the expertise on how to analyze it and find the hidden stories inside of it that will help governments, businesses and other organisations make better-informed decisions."
Tim also made it clear how fascinating statistics can be. "Statistics are anything but boring," he says. "The skills that statisticians have allow them to work on a variety of problems that involve business, the environment, conservation, health and so on. No matter where your interests are, there’s a problem for you to help tackle with your statistical expertise. It also allows you to get involved in a variety of different problems. That never gets boring!"
We also asked Tim for his thoughts on why it's so important for us to study statistics. "There is only going to be a growing demand for these skills," he told Bored Panda. "Students who take this path will definitely open themselves up to a world of opportunities."
If you'd like to hear more about the magic of statistics and check out The Random Sample podcast, which Tim tells me is preparing to re-launch soon, you can find it right here.
You probably use statistics in your daily life more than you even realize. Even if you are not sitting at a computer analyzing data or crunching numbers, somebody is doing it behind the scenes to make your life easier. According to Michigan Technological University, the importance of applied statistics has increased exponentially over time, so in today’s data-driven world, we rely more heavily than ever on the discipline of statistics.
Michigan Tech notes the census as a prime example of how statistics have become more prevalent over time. The United States conducted its first census in 1790, but since then, the census has become more and more comprehensive. It now covers a diverse range of topics to provide accurate information about the demographics and economic information of the population. The statistics garnered from the census are then used to help governments make decisions affecting the allocation of funds, congressional representation, where school districts lie and much more. In fact, the American federal government now has 13 statistical agencies analyzing information related to labor trends, health, education, and much more.
Every government and organization around the world relies heavily on statistics to get anything done. The United Nations Statistics Division even refers to the role of official statistics as an “indispensable element in the information system of a democratic society” and “one of the cornerstones of good government and public confidence in good government“. Accurate statistics are vital to politicians who need to know where to campaign and what demographics to target and to law enforcement agencies attempting to combat crime and fraud. If there were no records showing how effective, or ineffective, methods have been in stopping crime, agencies would simply be blindly guessing by trial and error, wasting time and resources and allowing for many more victims.
A few of the examples Michigan Tech provides for how governments use statistics every day are for tracking economic numbers, conducting federal science research, and collecting and analyzing educational data. It is crucial that governments keep a close eye on all of this information to better serve their constituents and make decisions in the best interest of the nation.
This explains my husband. He's never worn deodorant and he can't understand why everyone else does. I keep trying to explain that he's unique - maybe if I show him this, he'll get it!
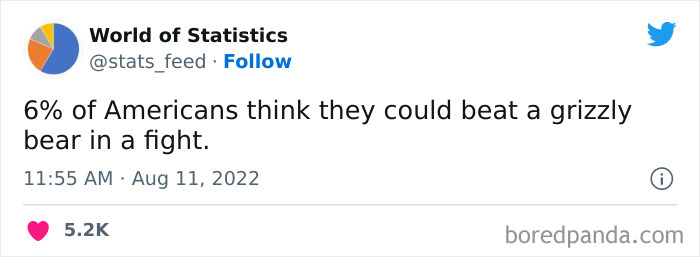
Grizzly bears are BIG. Don't try to engage one, you will lose. Even shooting one will probably just make it angry and it will maul you to death before it has a chance to bleed out.
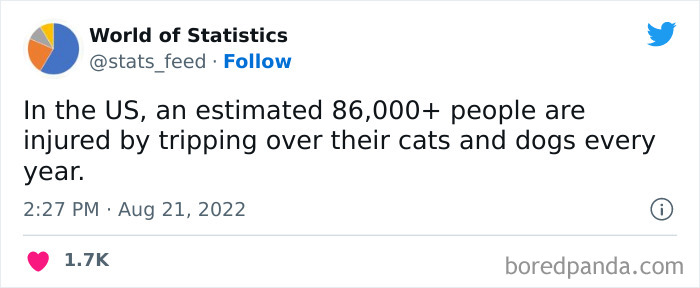
I get this, cats will run right into the area you would step, after they had been following you. I broke the screen on a new laptop because a cat did that and I didn't want to kick her. Instead I fell on my bed, and broke the screen. 10/10 would do again
Imagine if we did not have any accurate statistics available to help us make informed decisions. How many people die climbing this mountain each year? I have no idea, so I’ll just assume there is no risk! What are the chances that it will rain on this particular day in April? I’m not sure, so I’ll plan my wedding to be outdoors with no backup plans whatsoever! Is it healthy to eat red meat three times a day every day of my life? Nothing is telling me otherwise, so I’ll just carry on this way. Okay, you get the point. But can you imagine if we really were running around making decisions with absolutely no information to go off of? Life would be chaotic, dangerous and reckless. I, for one, am extremely thankful for whoever is out there cracking away at a computer and conducting surveys to make my life easier.
Statistics can be comforting as well. If you have a phobia of sharks or plane crashes, it might actually be nice to learn the exact numbers on how often these freak incidents occur. In the entire year of 2021, worldwide, there were only 137 shark attacks reported. And of those attacks that were unprovoked, only 9 ended up being fatal. Considering how massive the planet is and how many people go swimming, surfing and poking around in the oceans each year, your chances of avoiding sharks are pretty good. And when it comes to plane crashes? The average person’s risk of dying on a commercial flight, due to an accident or crash, is about one in 29.4 million. That is extremely unlikely. Feel safer traveling now?
If you’re a sports fan, it’s likely that you are invested in statistics as well. Data analytics are extremely important in professional sports to improve players’ performances, decide which players to draft and sign, determine what course of action to take depending on the opponent at hand, and to decide how much to pay each professional athlete. Coaches and players often analyze hours of footage to find out exactly what they did well and how to replicate it, along with what went wrong and how to prevent it from happening again in the future. Almost everything can be broken down to a science, including how to win a national championship.
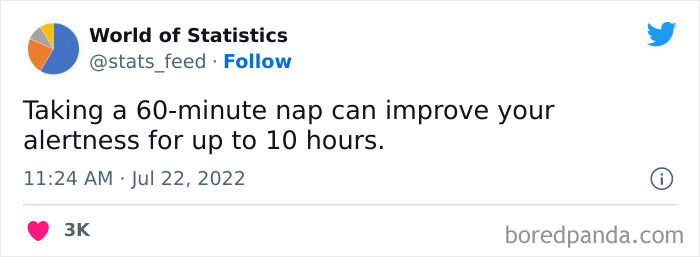
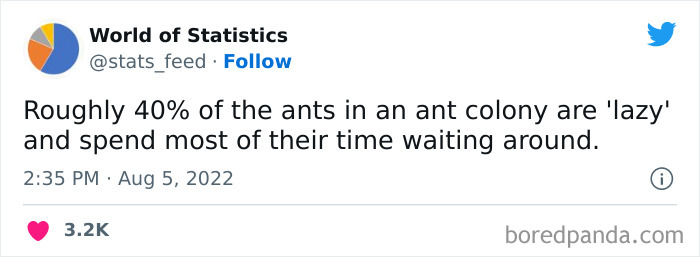
How is this measured? I don't necessarily dispute this claim since I myself like to pace; but I remain wary of statements involving precise quantification of subjective qualities
Statistics are also necessary to have proof of just how great an athlete is. Any casual UFC viewer can see that Kamaru Usman is an incredible fighter, but it is much more impressive to know that he has 20 wins and only 2 losses in his professional career. He also had been taken down by an opponent exactly 0 times until recently. Accurately tracking statistics on athletes may not be a life or death situation, like keeping a close eye on Covid-19 rates or a nation’s health information, but it certainly is fascinating. And it can help a player solidify their title as greatest of all time or help them land a spot in the hall of fame.
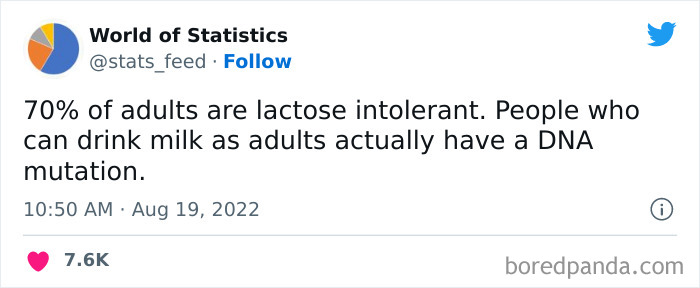
Last I read this it said that only 10% of people weren't lactose intolerant.
Statistics have been vital in our lives long before the pandemic, but I, personally, have never looked at so many charts in my life as I have since March 2020. It is extremely important for governments and citizens to understand and accurately record what is happening with the pandemic to keep everyone as safe as possible. If we had no records of when rates began spiking, particularly death rates, we might not have taken any action to stop the spread until it was too late. While Covid-19 has already impacted all of our lives, I cannot imagine how devastating the effects could have been without the millions of people around the world who did everything they could to keep tabs on this illness.
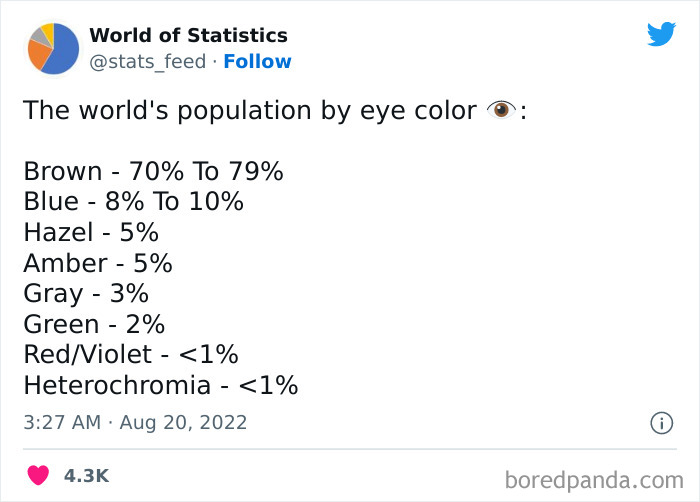
Heterochromia is where a person has a different eye color in each eye 👍
When it comes to having accurate statistics, we can all do our part to help out. When it’s time to record data for the census, please cooperate. Mail back your questionnaire, answer that phone call, or hop on the internet to be sure your data is captured. And if you take an at-home test for Covid-19 and you end up being positive, please report it to your local government or health agency. No matter how hard statisticians are working, they aren’t mind readers. We all have a personal responsibility to help spread accurate information.
We hope you’re enjoying this list celebrating the wonderful world of statistics and that you have learned some fun facts that you will be waiting to whip out at your next dinner party. The more we understand about the world, the more we understand ourselves and the deeper empathy we feel for others. Keep upvoting the stats that you find mind-blowing, and if you still haven’t had enough after finishing this list, you can check out another Bored Panda story featuring interesting statistics right here.
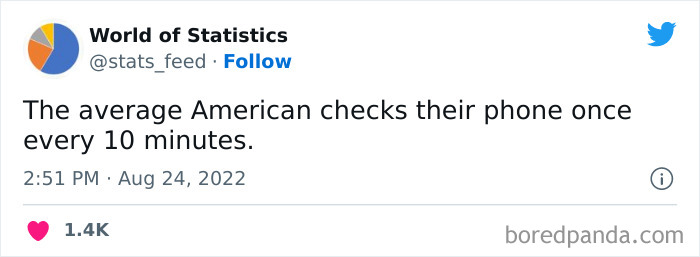
Wow, I would have assumed the number to be much higher! I wonder if they include Snapchat nudes and NSFW Instagram in there...
Interestingly enough, nuclear reactors these days are actually a safe and effective source of clean energy. Ironically many nations' green emission initiatives are being counterproductive with the closing of nuclear power plants, since the power will be supplemented by coal, leading to more pollution.
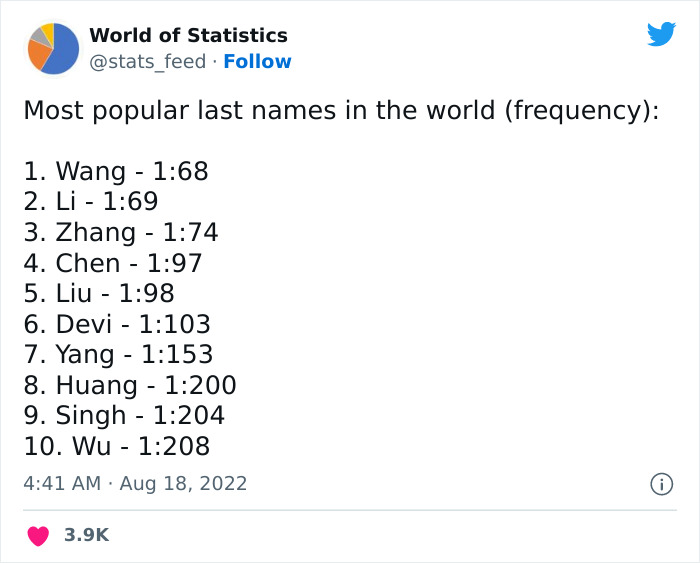
I like the implications of the phrasing "most popular" - don't most people inherit their family name?
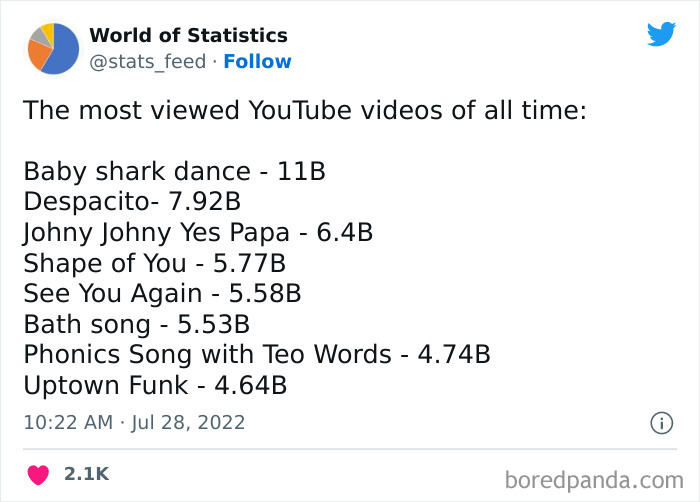
"Never Going to Give You Up" isn't even on the list? Dang, we've got work to do...
https://m.youtube.com/watch?v=dQw4w9WgXcQ You can help by clicking this link!!
Load More Replies...No, no you're lucky! But I bet you've actually heard a few of the songs...
Load More Replies...Never have I seen any one of these. And I am going to keep that going, too.
"Baby shark" and "Johnny johnny yes papa" been in the top 3 makes sense, considering how children loves to watch the same thing over and over XD
Is the shape of you one then official one or the teletubbies one? Please make it the teletubbies one.
Sorry to let you down, but I'm fairly sure it's Ed Sheeran.
Load More Replies...I will not look.... I will not look.... I will not look.... I will.....not.....
I've never watched any of these videos. I don't even know what most of them are. Lol.
Gangnam style at 10 ( I just looked) but the most amazing is Number 12 ....'The Wheels on the Bus' :D
Wonder how many baby shark views were just a parent leaving it on loop for a few hours and the kid not even paying attention after the first five plays.
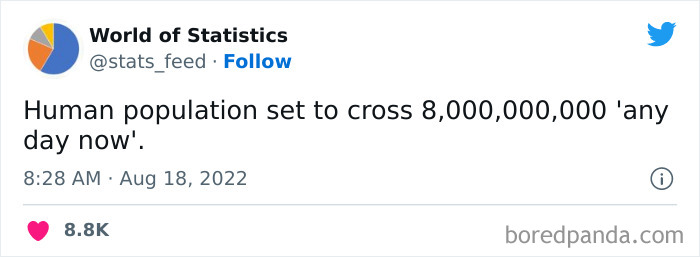
Don't worry guys, it won't take long for this information to be out of date!
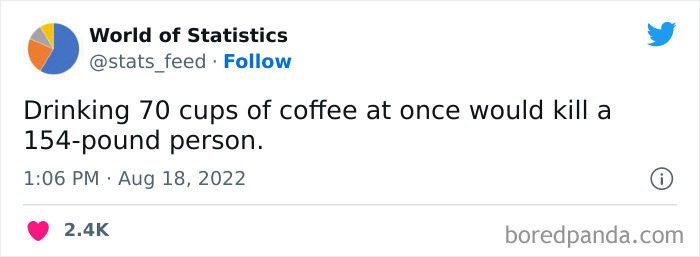
To be fair: the water in the coffee alone, if drank all at once, would result in water intoxication and would be lethal.
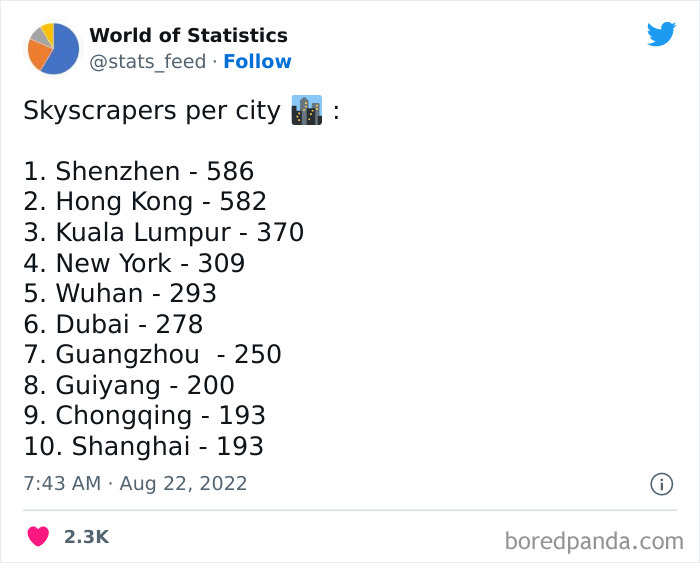
I can guarantee you that a lot of skyscrapers in Dubai are in downtown
I think that's why the article opens up with "there are 3 types of lies..."
Load More Replies...Another bp post ripped verbatim from another source and calls it an ‘article’. Stellar journalism 👎🏿
In 2007, toothpaste company Colgate ran an ad stating that 80% of dentists recommend their product. In reality, this is a famous example of misleading statistics. The ad suggested that dentists preferred Colgate over other toothpaste brands. But the survey asked them to list several brands of toothpaste they would recommend. The data only showed that Colgate was one of a number of different brands that dentists liked. Not quite the same claim, was it? Statistics = Misleading at best, lies at worst
I prefer sites like: https://www.visualcapitalist.com/ https://ourworldindata.org/

 Dark Mode
  No fees, cancel anytime


