ADVERTISEMENT
Article created by: Monika Pašukonytė

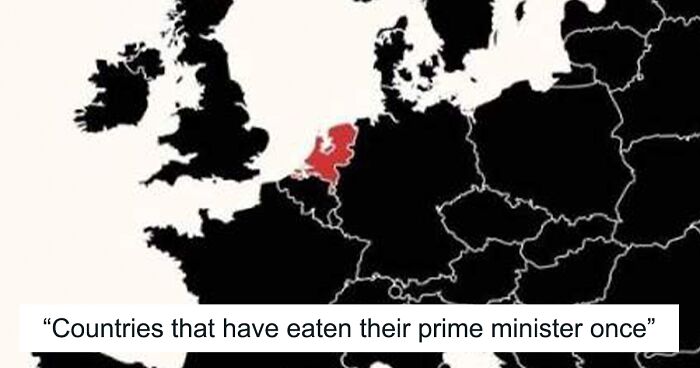
We all have geography lessons in school. And while we learn many interesting things about the maps and geography in them, there's always room for improvement. 

So, today, let's look at these interesting maps of Europe that we picked and found online. After all, there's no wrong time to learn something new. And who knows, maybe you'll end up using these facts somewhere (maybe a trivia night?), unlike some things you were taught at school.

More info: TikTok

#1

Map of European countries highlighting those that have eaten their prime minister in red, showing unique facts about European countries.

@earthstuffs Report

RELATED:
    #2

    Map of kid friendly cursewords in different European countries shown with colorful labels and text on a black background.

    @earthstuffs Report

    #3

    Map showing the latitude of world cities compared to European countries with key locations marked in blue and green dots.

    @earthstuffs Report

    #4

    Map showing average rent prices in euros for one-bedroom apartments in European capital city centers in 2021.

    @earthstuffs Report

    ADVERTISEMENT
    #5

    Map of European countries showing flags and highlighting who Europeans joke the most about in a fun geographic fact image.

    @earthstuffs Report

    #6

    Map of European countries showing where it is a crime to knock a door and run away, highlighted with color-coded facts.

    @earthstuffs Report

    #7

    Map showing which European countries have the most attractive people, highlighting Italy, Spain, and others, with SEO keywords.

    @earthstuffs Report

    #8

    Map showing facts about when women gained the right to vote in European countries with dates by region.

    @earthstuffs Report

    ADVERTISEMENT
    ADVERTISEMENT
    #9

    Map showing popular sports for fun in European countries, highlighting geographic sports facts and trends across Europe.

    @earthstuffs Report

    #10

    Map showing scariest facts about European countries with unique cultural and regional fears labeled across the continent.

    @earthstuffs Report

    #11

    Map showing average age women get married in European countries in 2021 with various age figures displayed.

    @earthstuffs Report

    #12

    Map showing languages of Europe around 600 AD highlighting historical language families across European countries.

    @earthstuffs Report

    ADVERTISEMENT
    #13

    Map showing average age Europeans leave parents house in 2021, with figures varying by country across Europe.

    @earthstuffs Report

    #14

    Map of European countries showing per capita consumption of butter versus olive oil in different regions.

    @earthstuffs Report

    #15

    Map showing estimated percentage of atheism in European countries in 2021 with facts illustrated by country data.

    @earthstuffs Report

    #16

    Air quality map of Europe showing pollution levels with color-coded statistics as a fact about European countries maps.

    @earthstuffs Report

    ADVERTISEMENT
    See Also on Bored Panda
    #17

    Map showing dinner times across European countries, highlighting cultural differences in dining habits and meal schedules.

    @earthstuffs Report

    #18

    Map showing trees per kilometre density across European countries with color-coded regions and a tree icon.

    @earthstuffs Report

    #19

    Map of European countries showing different traditional hats as a visual fact from European countries maps.

    @earthstuffs Report

    #20

    Map showing how to sneeze in different European countries with varied pronunciations highlighted by color.

    @earthstuffs Report

    #21

    Map showing European countries that have never experienced temperatures above 35°C, highlighting Iceland and Ireland in green.

    @earthstuffs Report

    #22

    Map showing Europe Black population percentages by country in 2020 as part of facts about European countries shown in maps

    @earthstuffs Report

    #23

    Map showing coffee consumption facts across European countries by annual per capita kilograms with color-coded consumption levels

    @earthstuffs Report

    #24

    Map of European countries showing percentages of men and women combined who would fight for their own country with key facts.

    @earthstuffs Report

    #25

    Map showing percentage of population in European countries aged 25-64 that can't speak any foreign language.

    @earthstuffs Report

    #26

    Map of European countries showing the number of prisoners per 100,000 people with color-coded data visualization.

    @earthstuffs Report

    See Also on Bored Panda
    #27

    Map of European countries showing percentage of people employed in science and technology in 2019, highlighting regional differences.

    @earthstuffs Report

    #28

    Map showing average male height in European countries in 2022 with data visualized using geographic boundaries for SEO facts.

    @earthstuffs Report