Get Premium
Dark mode theme is available exclusively for premium users. Learn more about the benefits of subscribing.
No fees, cancel anytime.

 Dark Mode Ad-Free Browsing Unlimited Content
 Ad-Free Browsing Unlimited Content Dark Mode
Join 1.2 million Panda readers who get the best art, memes, and fun stories every week!
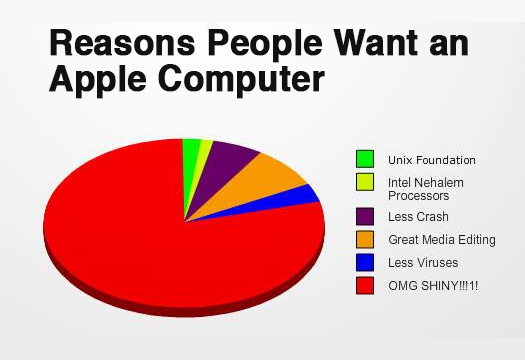
Who doesn’t love a good visual breakdown of data, neatly packaged for easy consumption? I’m talking rows, bars, tables, graphs, maps—the works. 2D, 3D, black and white, color-coded, all beautifully laid out for maximum clarity.
That’s exactly what you’ll find on r/charts—a subreddit dedicated to, well, charts. From serious and insightful to glaringly obvious and hilariously unnecessary, this place has it all. We’ve rounded up some of the best ones below. Enjoy!
This post may include affiliate links.
When busses go where and when people need to, without an hour wait for the next bus, without having to go into the city center then back out so as to reach a neighboring area, when they run late enough, they might be a viable option.
And people say GMO is bad, but all of those are Genetically Modified Organisms.
The US really need to dump that fixation on two parties. In a solid democracy there are 20 parties to choose from, every vote is counting directly for the result without filters, no winner-takes-it-all and a % bar that prevents a tunnel view. This results in a coalition of 2 to 3 parties in power of governing a coumtry and 3 to 4 i opposition = the sound of reason is always present.
Go back further, there's even more color. I'm so sick of looking at grayscale cars. No personality, just endless shades of grey. What free car colors we're offered are often blue-grey, green-grey, brown- grey. Like how many shades of boring are there???
Must be old,the latest number I saw was 8.2B? Or the number I saw is wrong?
So does the gray mean that in those areas, there are no gun laws at all?
Housecat... are you kidding me! A cobra you could run from. But a cat fighting for its life will f**k you up completely!
Again old data? A quick googling found they estimate the deaths from covid is 7M?
The actual greatness of those lakes doesn't really show. There should be a scale at least...
Why would you believe a chart or graph made by someone who can't even spell the things they're charting and graphing correctly?
Why would you believe someone, who can't use proper punctuation, what proper is?
Load More Replies...There's a difference between different spellings & pronunciations because of dialects and just having bad grammar
I didn't understand a lot of these, often because they were too small to really see what was going on.


 No fees, cancel anytime


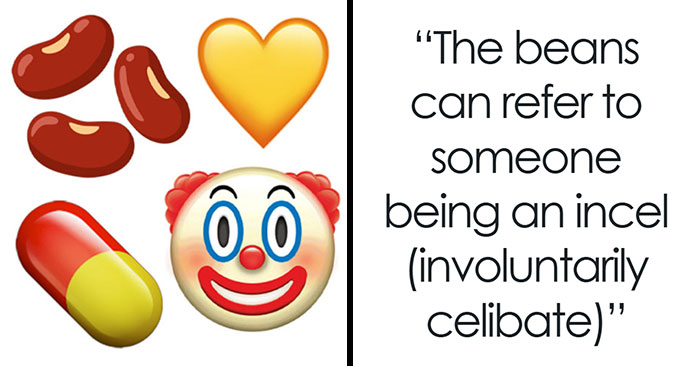
 view it as protected free speech.")


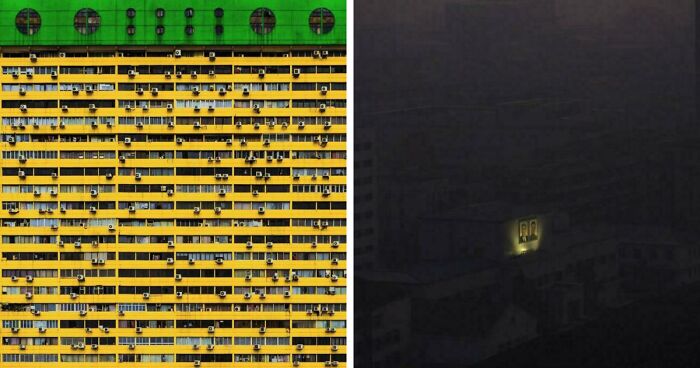
 and uninhabited (blue) areas.")


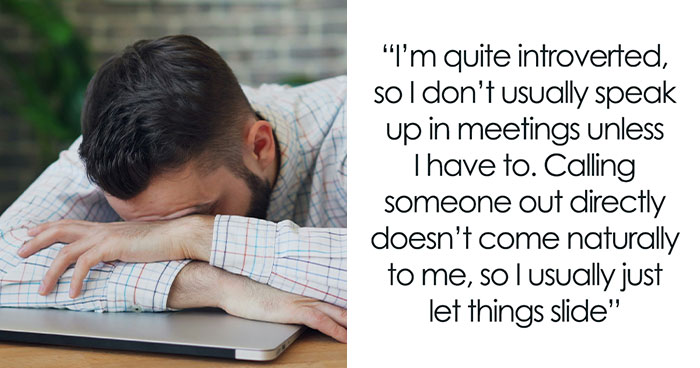
 at various temperatures, visualizing global data in a fun way.")


")
")