40 Interesting Charts People Shared On This Group That Might Change Your Perspective On Things
InterviewData is beautiful—and I’m in love. I swear it’s not just because of its gorgeous pie charts, voluptuous curves, and stunning axes... Promise! When it comes to showing off just how stunningly data can be presented, there’s no better to place to feast your eyes than the ‘Data is Beautiful’ subreddit that hosts a massive community of over 15.6 million people and which celebrated its 9th birthday in February.
The community is full of math, statistics, and art lovers, as well as professionals who use data every day. Often, they get so inspired by the eye-pleasing charts and graphs, they create their own and end up on the front page of Reddit.
We’ve collected some of the most aesthetic expressions of data found on r/DataIsBeautiful for you to enjoy, so scroll on down and have a peek, dear Pandas. As you dive deep into the world of stats, upvote the images that you liked the most. Remember, the charts love it when the numbers go up. (Pssst, the subreddit even has its own Twitter page and Discord server.)
I had a lovely chat with some of the moderators running the ‘Data is Beautiful’ community, including redditors NotABotStill and PHealthy. So be sure to read on for the in-depth insights they shared with Bored Panda about the ins and outs of how the small team of professionals manages the massive community of content creators. They’re a very friendly bunch, so you shouldn’t hesitate to join the community if you’re into charts, graphs, maps, or, well… simply love looking at pretty pictures.
More info: Reddit | Twitter | Discord
This post may include affiliate links.
A Year Ago I Was Hospitalized For A Failed Suicide Attempt, I Decided Then, That I Wanted To Be Healthier And Happier; This Is What A Year Of Therapy And Proper Medication Can Do. Don’t Give Up
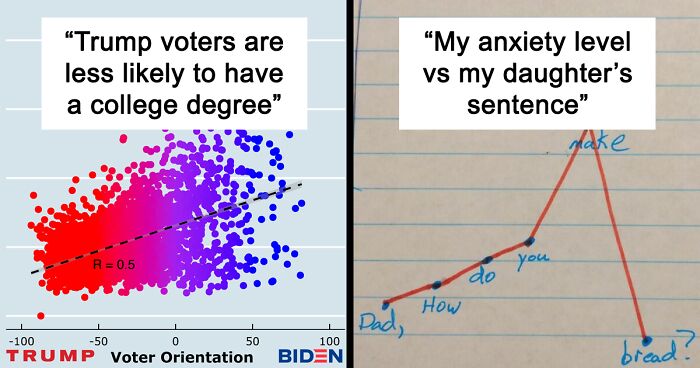
My Anxiety Level vs. My Daughters Sentence
Despite having millions and millions of members, the subreddit still maintains some of the core tenets that they had when it was still founded. The moderator team is purposefully left as a small group of professionals who focus on data visualization as some part of their careers and lives. That passion for data translates into passion for the r/DataIsBeautiful community.
What’s more, the subreddit treats its original content creators as “first-class citizens,” constantly engaging them, and making sure they’re credited and acknowledged for their work (as all creators should be!).
“We bring a data-centric view of the world to millions of people every day—from important information about the COVID-19 pandemic all the way to a random dude's daily bowel movements—and our community prides itself in that fact. For example, we had community members posting analyses and projections of COVID-19 trends back in January and February 2020—well before anyone in the U.S. was taking the pandemic seriously. /r/DataIsBeautiful is THE place to go when you want to see the signal through the noise of hectic daily life,” one of the moderators explained why the community is so loved and popular.
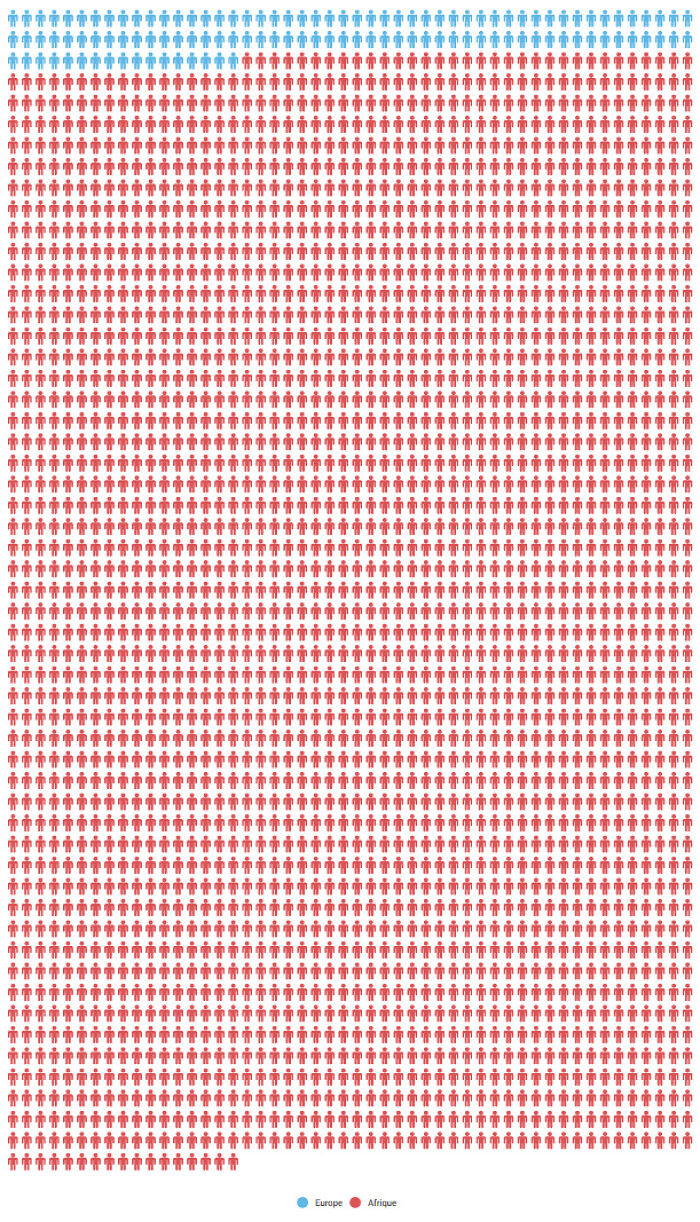
People Killed In Terrorist Attacks In 2017: Europe (Blue) vs. Africa (Red)
6 people dead in the USA = World news.... 200+ school children kidnapped from a school every other week in nigeria and it's hardly a blip in the news. I wonder if people know that there have been 4 mass kidnapping in nigeria this year alone... at one school, they took 317 girls
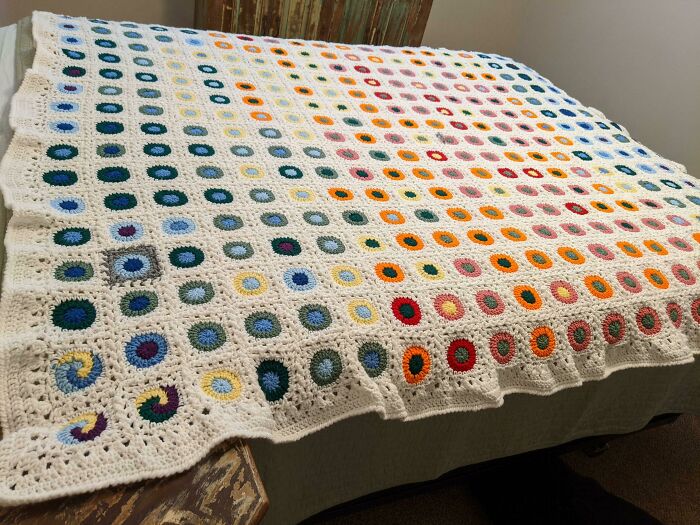
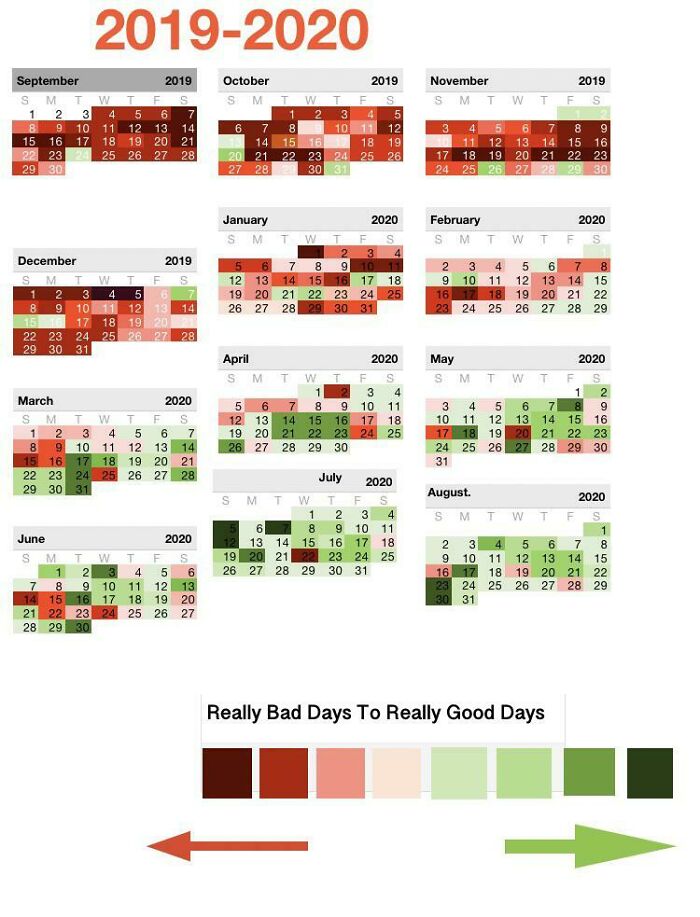
I Finished My Year Long Temperature Blanket!
The amount of posts and comments that the mods of r/DataIsBeautiful have to deal with is absolutely staggering. I’m not exaggerating when I say that my jaw dropped when I heard about it. The subreddit gets roughly 400-500 submissions each week and has had 2,370 approvals, removals, and spam posts over the last month alone.
Meanwhile, the number of comments they get is beyond counting, but the mods estimate that the number ranges in the tens of thousands and might even be as high as over a hundred thousand.
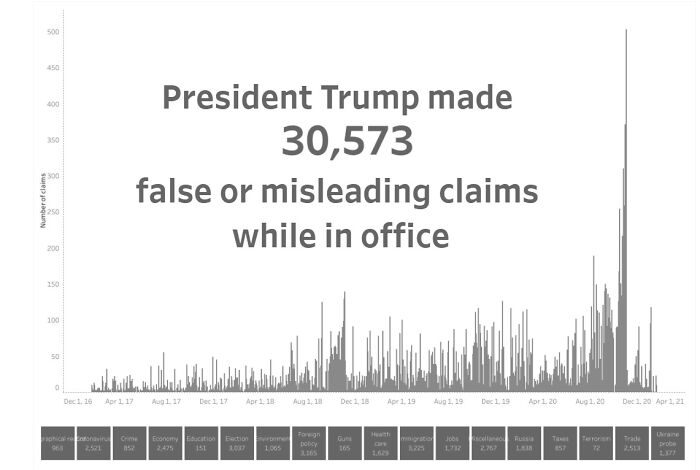
President Trump False Or Misleading Claims While In Office
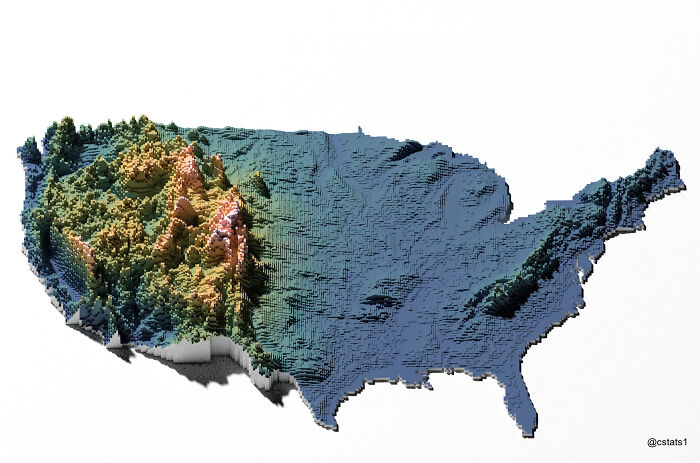
Us Elevation Tiles
Colorado represent! I grew up there. It wasn't until I moved away that I realized people elsewhere don't usually know what elevation they're living at.
Redditor NotABotStill has been a moderator at r/DataIsBeautiful for two years and revealed to Bored Panda that the mod team is global, with members living in the EU, US, and APAC, so that they can cover all the time zones.
The level of professionalism that they have is pleasantly surprising. However, that makes sense once you realize that they’re actually all professionals in their personal lives and are a very close-knit group who regularly communicate. You can expect this level of dedication from people running a successful company.
“We certainly refine the rules over time. For example, we no longer allow YouTube videos as it was being abused by content creators looking for subs on their channel. We also occasionally temporarily prohibit specific subjects, like Tinder or dating posts, when a topic overwhelms the subreddit although dating posts are allowed again,” moderator NotABotStill explained.
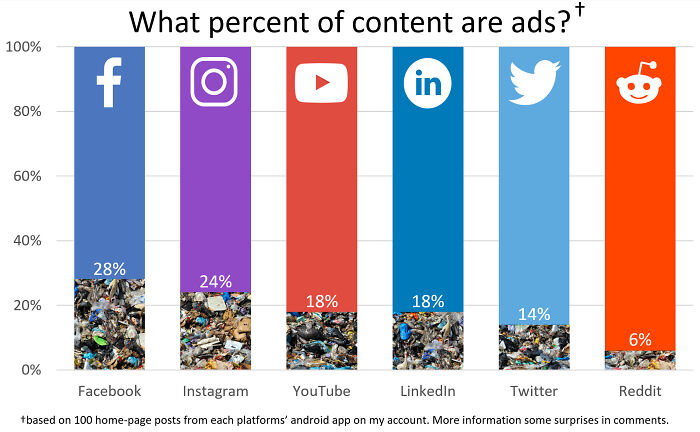
What Percent Of Social Media Content Are Ads?
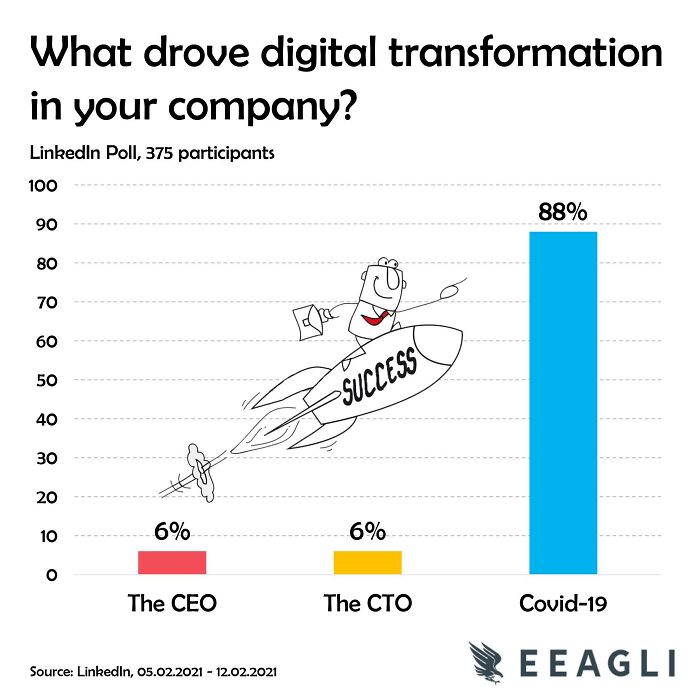
I Ran A Quick Poll Last Week On Digital Transformation
“We also only allow personal posts (posts about the poster such as miles jogged over a year as an example) on Mondays which I believe we instituted during my tenure. That's just a flavor of the types of rules we add, adjust, or remove over time. Rule changes are done by consensus of the mods and we will often spend days or weeks deciding on new rules and how to word them,” they said that they’re always moving towards perfection, with a lot of time spent on making the subreddit better and better.
The moderators manually approve or remove each and every post, but they mostly rely on their fellow redditors to report posts and comments that violate their rules of conduct. They also use AutoMod to help move the process along. Posts that go against the rules end up being automatically removed, so the mods can spend more time on important issues rather than chores.
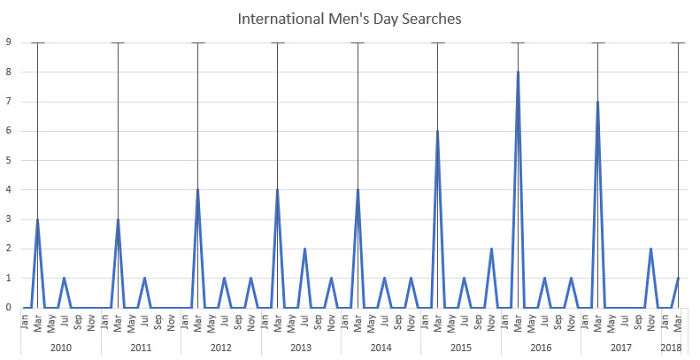
Searches For International Men's Day Peak Every International Women's Day
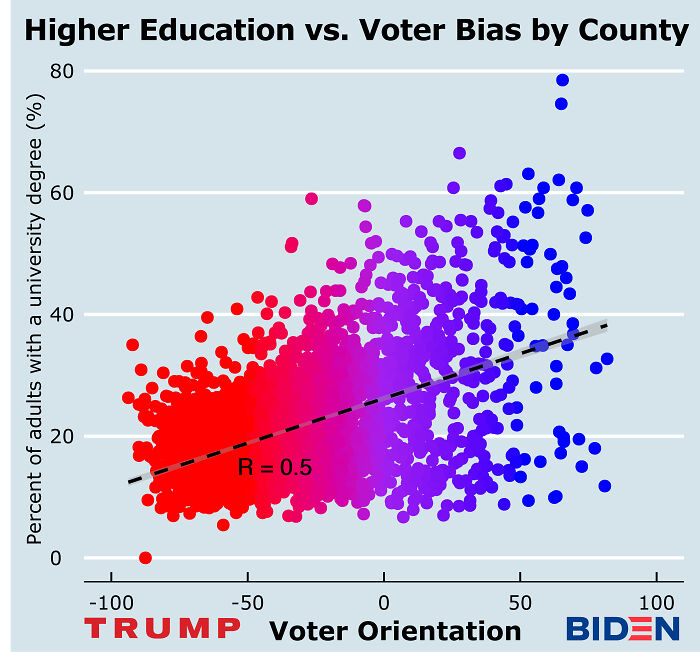
Trump Voters Are Less Likely To Have A College Degree
“Most posts are visible immediately, however, we also utilize AutoMod to ‘filter’ out posts that likely violate a rule. Speaking of AutoMod, we heavily rely on it to filter, or make invisible, both posts and comments based on keywords, user karma, and URL links (to name a few) which then have to be manually approved before they are visible. We also utilize it to automatically remove posts that violate our rules (e.g., YouTube links or directly linking an image and not claiming [OC]) so we mods don't even have to see them.”
NotABotStill pointed out to us that popular posts on the subreddit “are often approved multiple times” because they’re reported while some posters end up reposting the images because the AutoMod catches the [OC] error. That means that the number of original monthly posts is probably closer to 1,500 to 2,000, once you do away with the reposts and multiple approvals.
Paths Of 800 Unmanned Bicycles Being Pushed Until They Fall Over
Selected Leaders During The Queens Reign (Up To Now)
Moderator NotABotStill explained that they rely on the users to upvote and downvote submissions and don’t make subjective evaluations about how each one is or isn’t aesthetic. In other words, what the community thinks is incredibly important.
When asked, the mod said that they wouldn’t be able to choose between which they like more, pie charts or bar graphs, and would prefer “a simple Excel line chart any day over those two.” (Personally, I know I should prefer bar graphs, but my heart belongs to pie charts.)
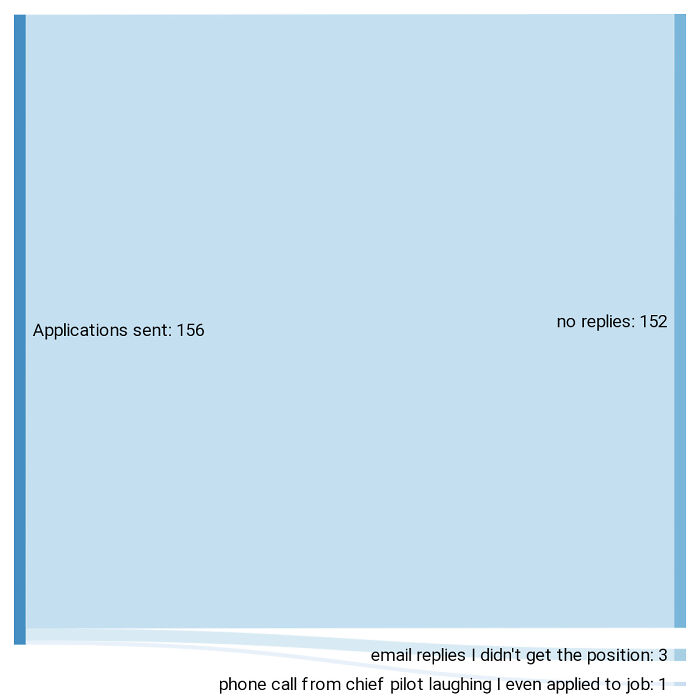
My Experience Of Trying To Find A Job As A Pilot In The Last Four Months
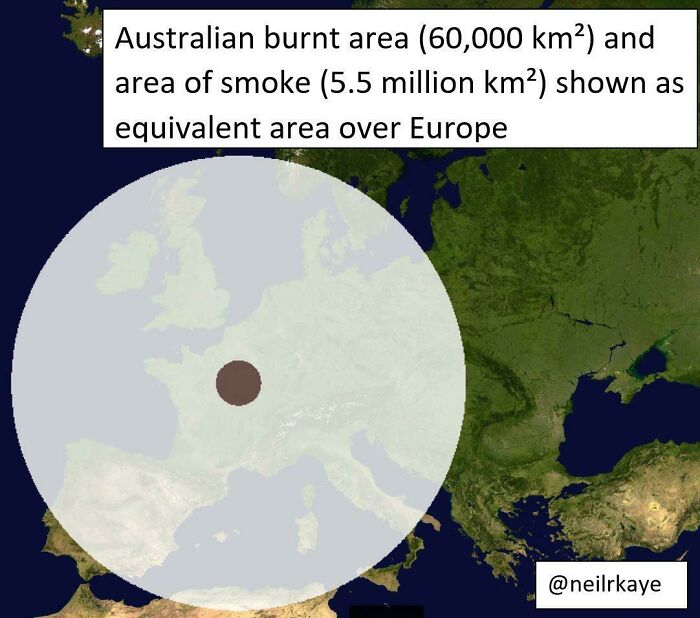
Area Of Land Burnt In Australia And Area Of Smoke Coverage Shown As Equivalent Area Over Europe
Meanwhile, moderator PHealthy highlighted that the subreddit has had “fairly linear growth” since being founded in 2012. The growth started to slow down in 2017 and 2018, however, the sub is still adding thousands of new members each day. “That said, with the way Reddit works the subscriber count isn't all that important above a certain point which is enough to it r/all and/or the front page. That hits on a topic most of the more serious subreddits face: good content vs popular content.”
PHealthy said that moderating the community is a team effort. However, some mods go “above and beyond and really keep the community moving” where the automated mod tools end up not being enough. “I moderate a few other large communities so I split a lot of my time and try to help with the modqueue as much as I can but really only go after the real egregious offenses like hate speech, racism, personal attacks, etc.”
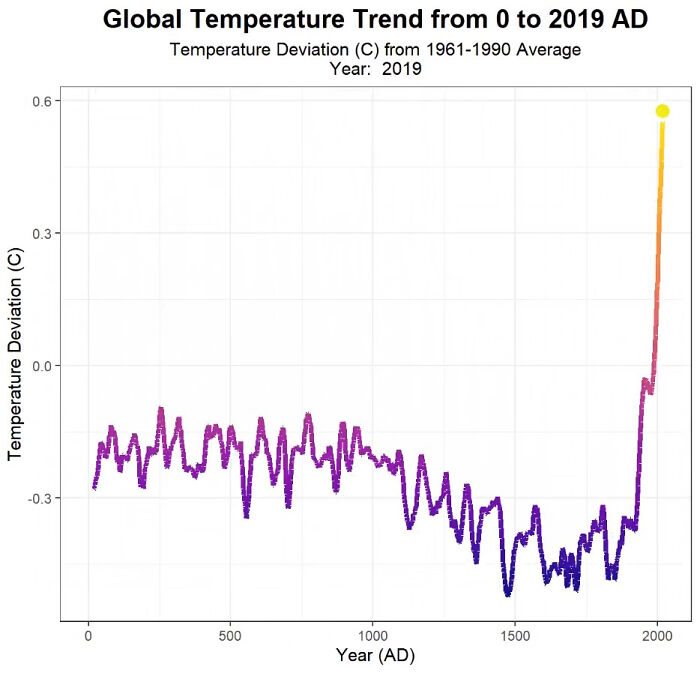
Two Thousand Years Of Global Temperatures In Twenty Seconds
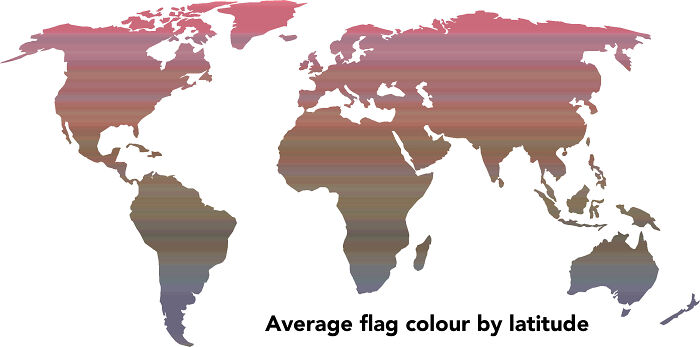
Average Flag Colour By Latitude
The moderator added that the number of submissions can vary depending on what’s happening around the globe at the time. “COVID for instance gets a big spike as well as popular post copycats.”
In PHealthy’s opinion, animated graphs are rarely better than something like a grouped bar graph, even though they certainly draw the eye. “Pies and bars certainly both have their uses but we've all seen the results of tortured dataviz and I think that's where something like the pie chart gets a bad rap.”
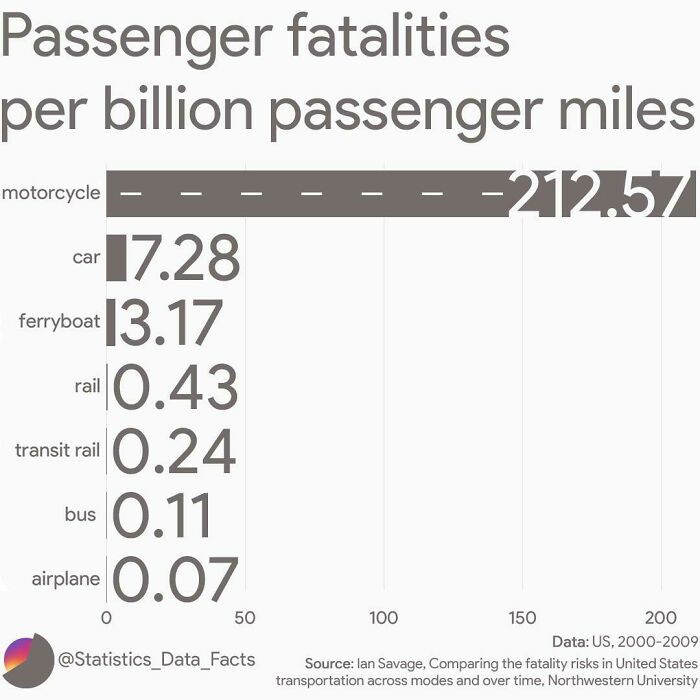
Passenger Fatalities Per Billion Passenger Miles
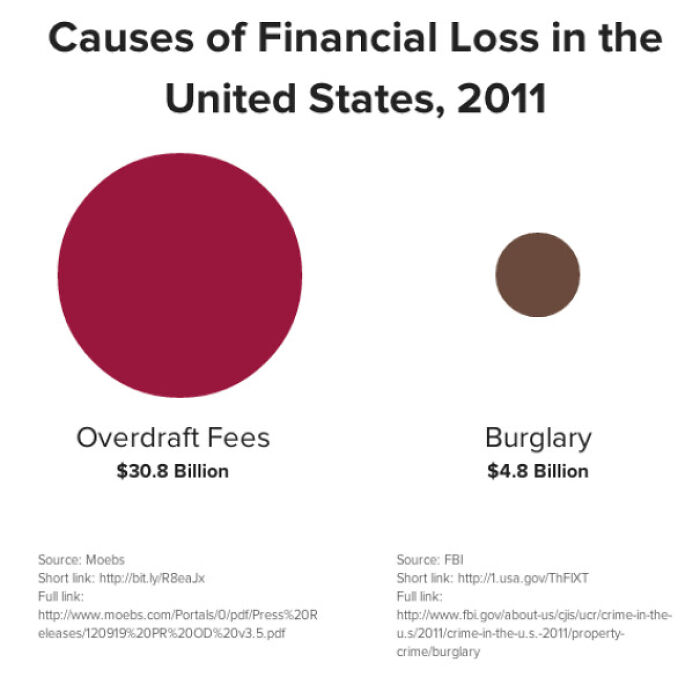
Causes Of Financial Loss In The USA, 2011
The moderators of ‘Data is Beautiful’ also went in-depth around what kind of content they consider to be good, what visualizations are popular, and what falls into both categories (if this were a Venn diagram, the latter would be the part where the two circles intersect).
Here are two examples of top posts in the last month that “look good and engage the audience to change over time on a popular subject” right here and here. Meanwhile, images like this one and this one might be popular because of the subject matter and what Redditors prefer, however, they’re “awful” and “difficult to read.”
Finally, here’s an example of great data visualization that, unfortunately, doesn’t do great because the subject matter doesn’t appeal to the audience or it’s too technical.
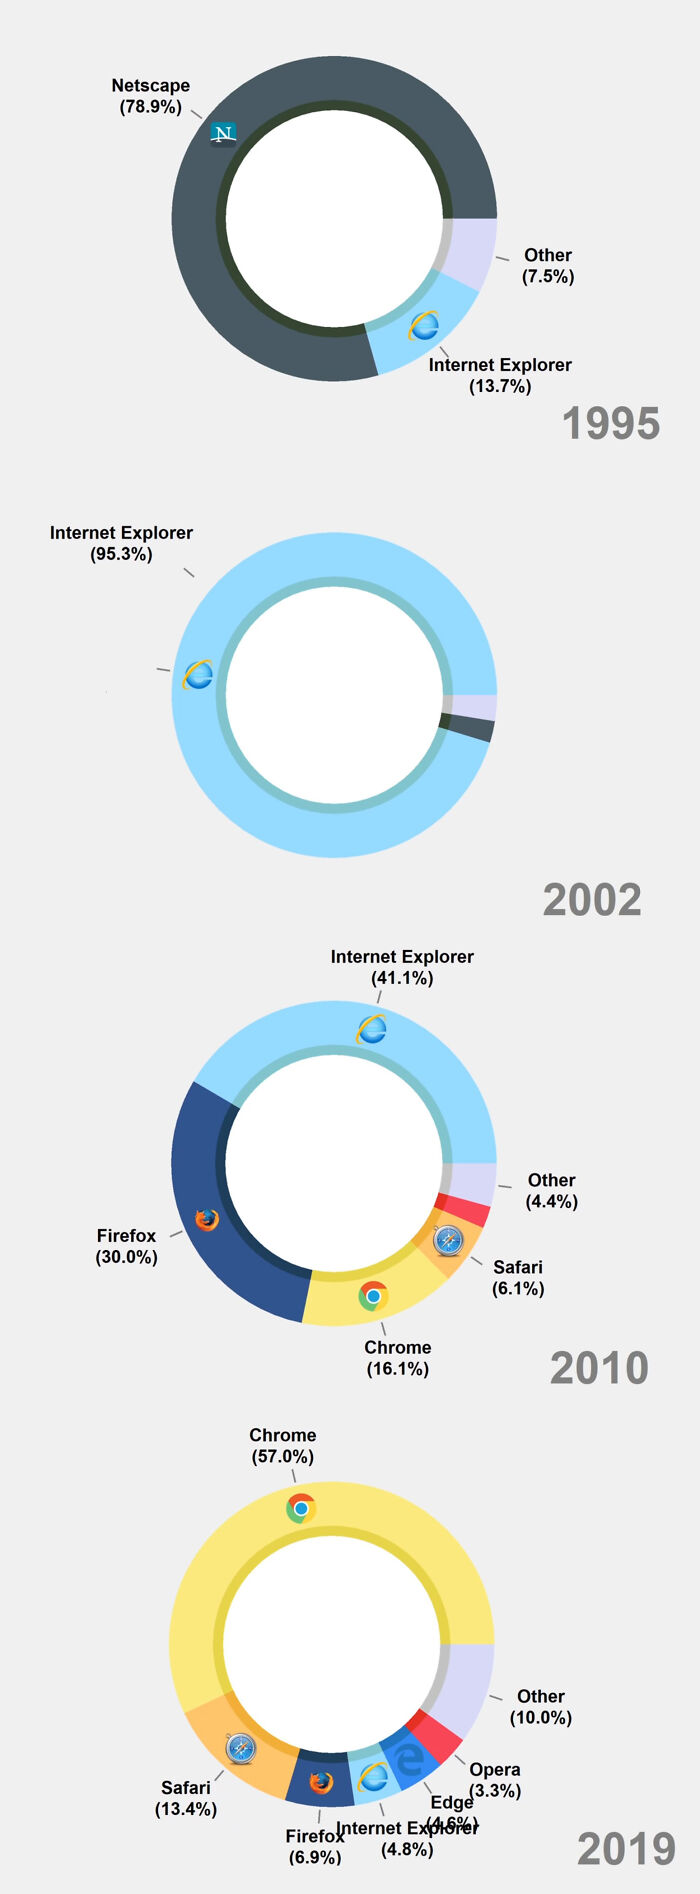
Most Popular Web Browsers Between 1995 And 2019
Never even heard of Netscape. For me I have found Opera and Google chrome to be the best. And I hate Firefox.
My Wife Made This Blanket That Indicates A Certain Temperature For Every Day Of The Year. 2016 Pennsylvania
The ‘Data is Beautiful’ subreddit is about finding the perfect blend of beauty and brains. Or about the best way to present any particular dataset if you look at things from a different perspective. The subreddit is here to share and discuss all the various visual representations of data. From graphs and charts to, yes, even maps!
Another moderator who’s had 7 years of experience working with r/DataIsBeautiful explained that “back in the early days,” they were a niche community focused on attracting data visualization researchers and professionals. With the occasional enthusiast dropping by, too, of course! Eventually, with the growth of the community thanks in large part to a cordial relationship with the Reddit administrators, the subreddit grew to encompass a much broader range of members.
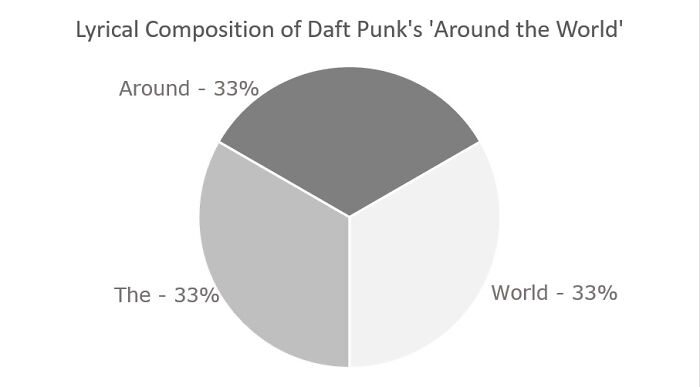
Lyrical Composition Of Daft Punk's 'Around The World'
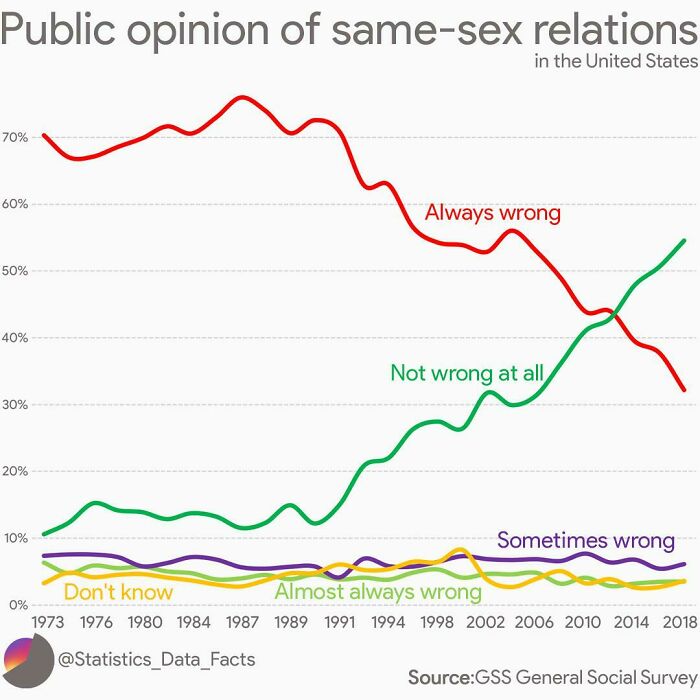
Public Opinion Of Same-Sex Relations In The United States
I get the logic behind "never wrong" and "always wrong", but what's the possible explanation for "sometimes wrong"? Like Wednesdays and Fridays?
as a bisexual, it makes me happy that that the green and red lines have crossed
Love is love. Always has been. Always will be. God I can't even imagine how hard it must have been to keep their relationships hidden during the earlier days. Glad things are changing (even if it's still slow) for the better.
I'm glad the majority has come round. I was brought up in a house where my parents were generally against, although not outspoken about, same sex relationships. I never had a reason to 'disagree' with them purely because I never thought about it. When I did have cause to think about it I realised there was no reason at all to be against someone's sexuality. It really is none of my business anyway and they have every right to love who they love..
Fun fact: I have a T-shirt that says ‘love doesn’t discriminate’ on it. It’s a mix of pride and Hamilton, and the best thing ever.
I think it just means that outdated ideas are dying along with outdated people... but I'm not sure that it means that we're really getting better.
Load More Replies...Peak of the AIDS crisis maybe? Where there was a lot of misinformation regarding the virus
Load More Replies...Very narrow interpretation. TV followed the change in culture.
Load More Replies...“Most of our discussions back then focused on critiques and improvements of the data visualizations themselves, a focus that still sits at the core of the community to this day,” the moderator shared what the start of the community was like.
“In February 2012, the Reddit admins and DIB mods agreed to make /r/DataIsBeautiful a default subreddit. That meant that every new Reddit user would automatically be subscribed to DIB and our top content would consistently show up on the Reddit front page. After that point, our community grew extremely fast and continued growing even when the default subreddits were abolished in mid-2017,” they shared one of the reasons why the sub grew as fast and as big as it did.
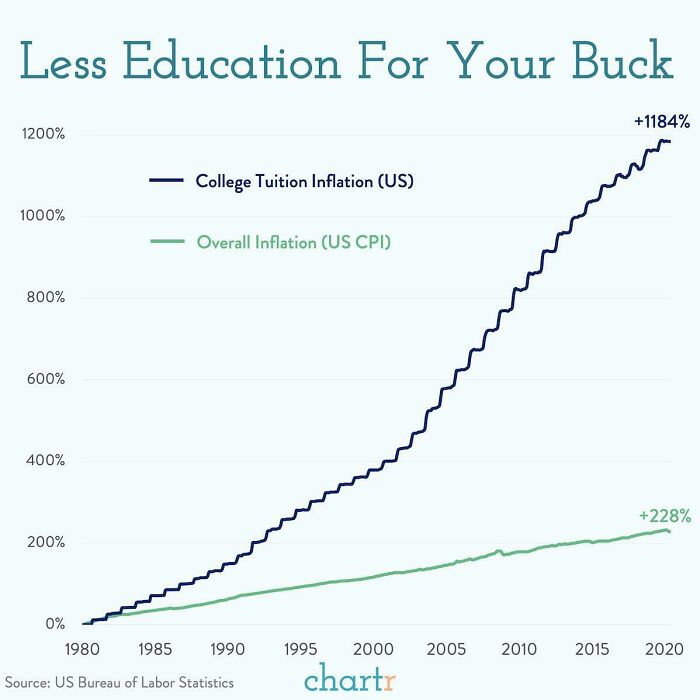
Us College Tuition & Fees vs. Overall Inflation
They got no justification for the prices they charge. Just a money making scheme.
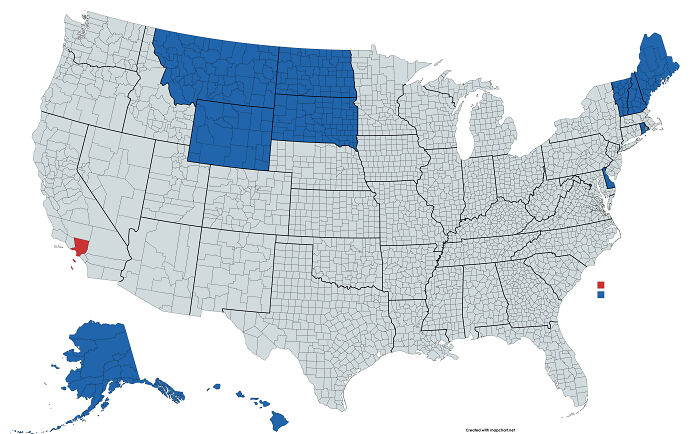
The States In Blue Have A Combined Total Population Equal To Los Angeles County, In Red
It really isn’t just about the pretty pictures, however. Anyone who wants to dig a little deeper and learn a bit more about how to visualize data well can do so. “We provide a handful of guides for folks just learning to create data visualizations, and we require every original content post to include at least a brief description of the data source and how the data visualization was created so folks can learn from that. DIB is a great place to learn the craft of data visualization by doing,” the moderator shared with Bored Panda.
2020 Electoral Map If Only ____ Voted. Breakdown By Each Major Demographics
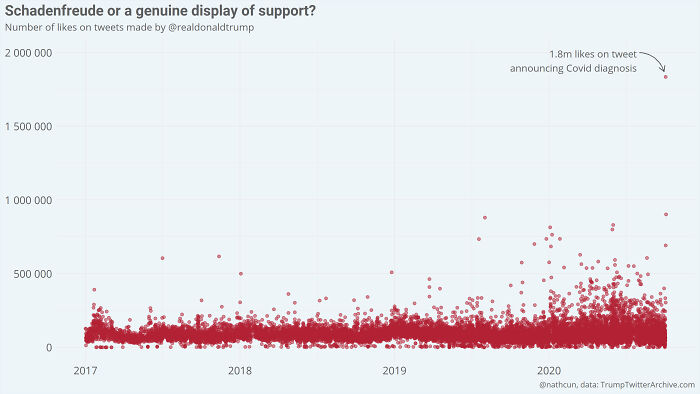
Donald Trump's Tweet Announcing His Covid-19 Diagnosis Is, By Far, His Most Liked Tweet Since Becoming Us President
“DataIsBeautiful is for visualizations that effectively convey information. Aesthetics are an important part of information visualization, but pretty pictures are not the sole aim of this subreddit,” the subreddit explains what it’s all about.
Now, pretty graphs might not be the entire story, but they can sure help express data in a way that grabs (and holds!) your attention, so you can understand the data better. Something that’s clear and stunning will help you remember it better. And if you understand something well, you can then use that data in arguments and (socially distanced) dinner parties.
Distribution Of Snickers Letters In My Halloween Candy
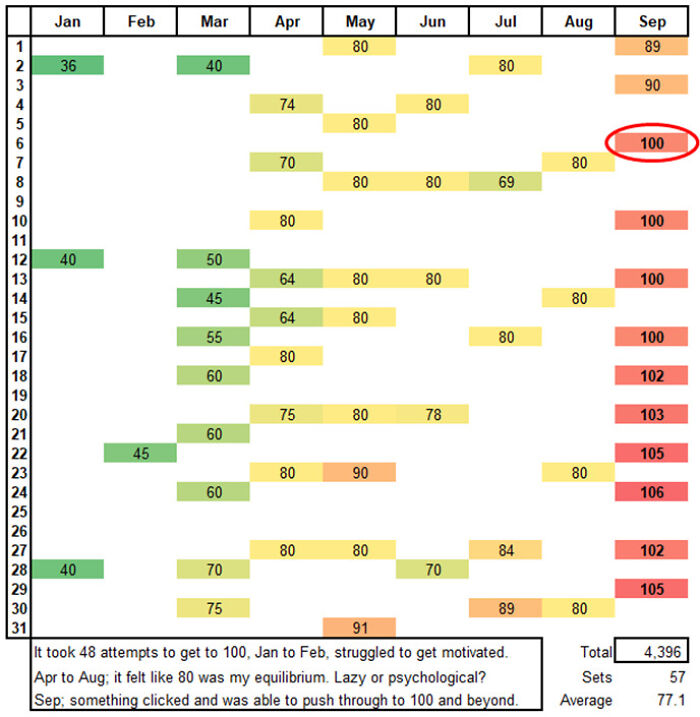
Tracking My Push-UPS In 2020. My New Year’s Resolution, Was To Do 100 Push-UPS In One Go. It Was A Slow Burn, Took Over 8 Months And 48 Attempts To Build Up My Strength And Stamina (Age 49)
As a whole, the community very much appreciates originality and creativity. They encourage people to post their own original content (it’s got that little OC sign next to in case you want to see what’s what). If there’s a graph that you love in particular, send the creator a warm ‘thank you’ to encourage them to keep on creating data eye-candy. And if you end up sharing it somewhere, be sure to credit it properly. It’s original content, after all!
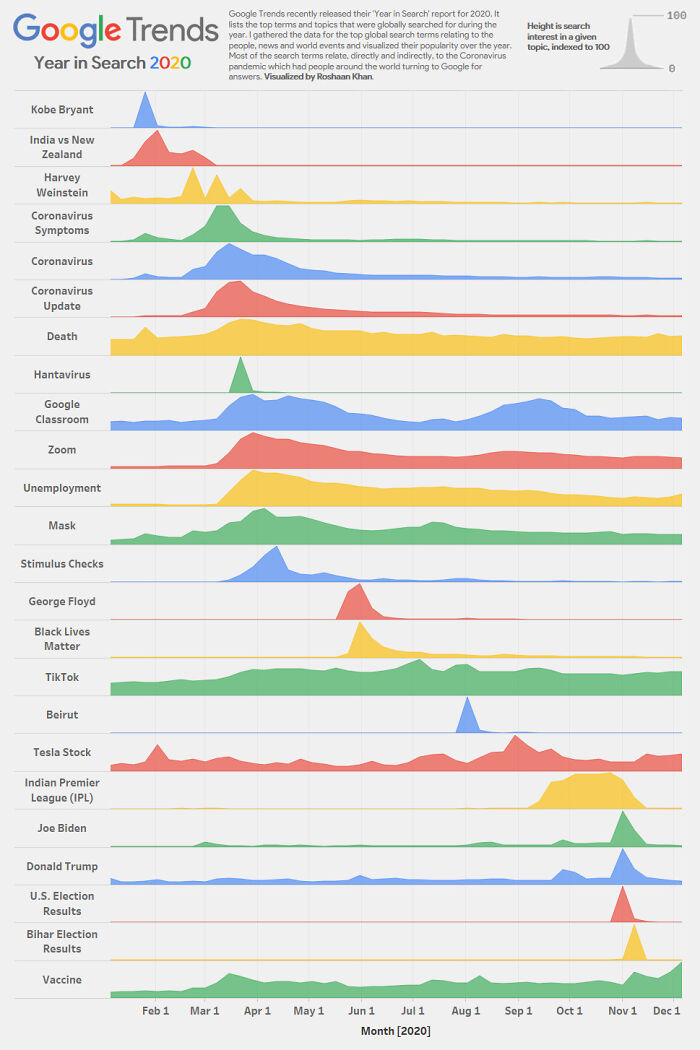
Google Year In Search 2020 Top Search Terms
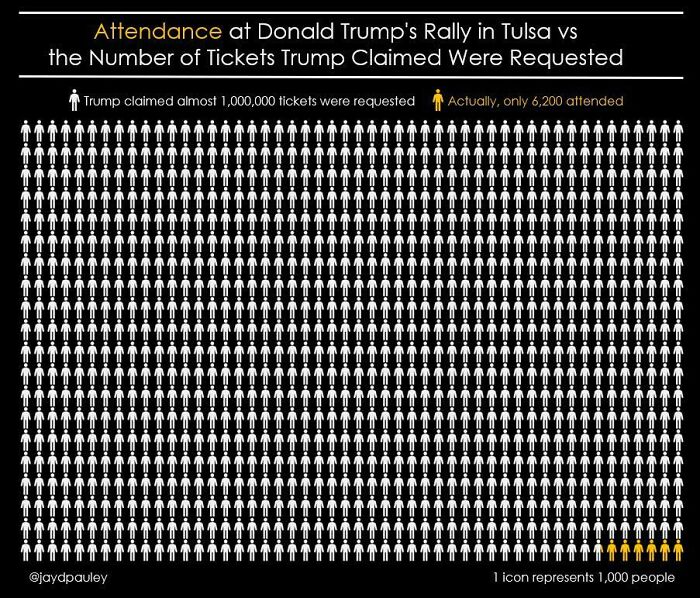
Attendance At Donald Trump’s Rally In Tulsa, Compared To The Number Of Tickets Trump Claimed Were Requested
So, dear Pandas, which chart or graph did you enjoy the most? Do you think that good data will always speak for itself or do we have to give it a gentle nudge to make it more palatable for our eyes and minds? Do you draw maps in your spare time just like I do? And, we’ve got to ask—do you prefer pie charts or bar graphs, dear Readers? Leave us a comment below!
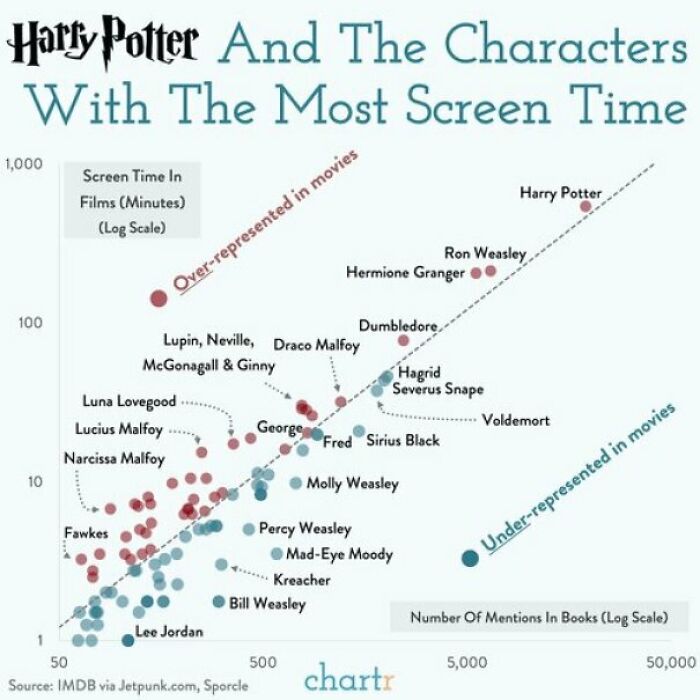
Harry Potter Characters: Screen Time vs. Mentions In The Books
11 Different Brands Of Aa Batteries, Tested In Identical Flashlights
Of course the Duracell lasted longer. It is longer in size than the rest! I think the experiment was biased.
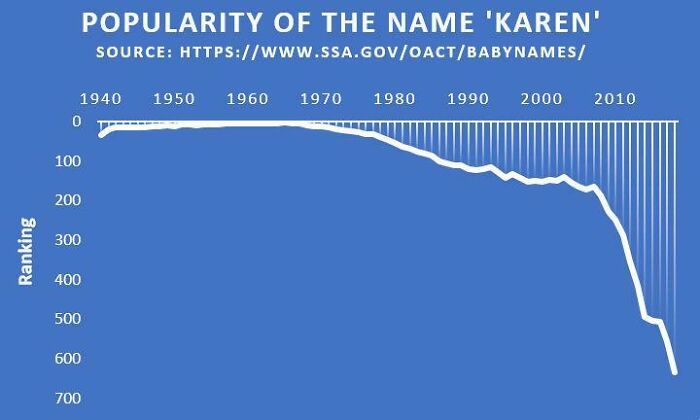
The Popularity Of The Name ‘Karen’ Has Seen A Dramatic Decrease Within The Last Ten Years
Cause Of Death - Reality vs. Google vs. Media
Berlin Subway Map Compared To Its Real Geography
Percent Of Air Per Bag Of Chips
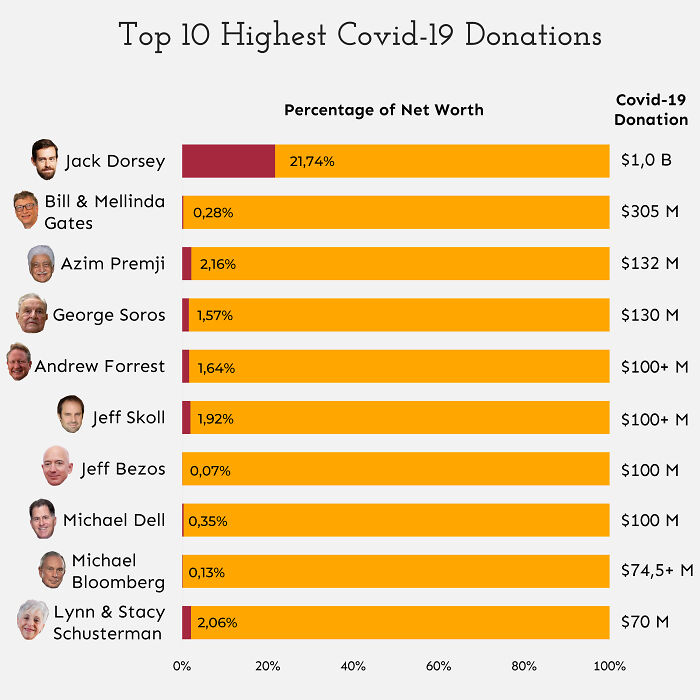
Top 10 Highest Covid-19 Donations With The Percentage Of Their Net Worth
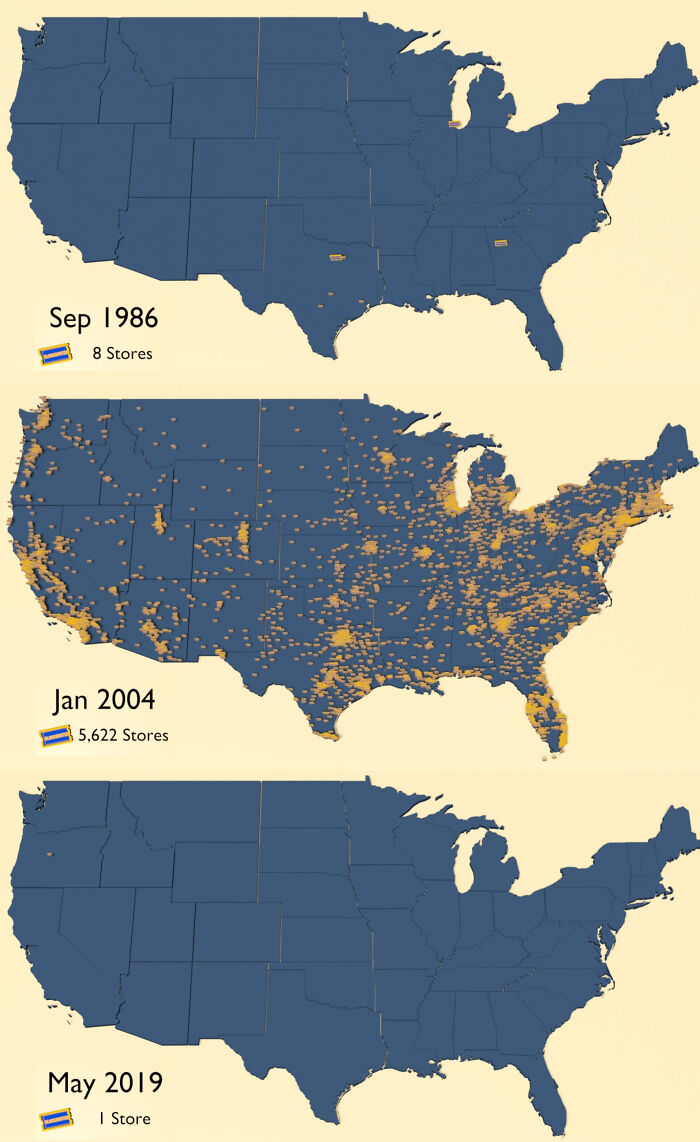
Blockbuster Video Us Store Locations Between 1986 And 2019
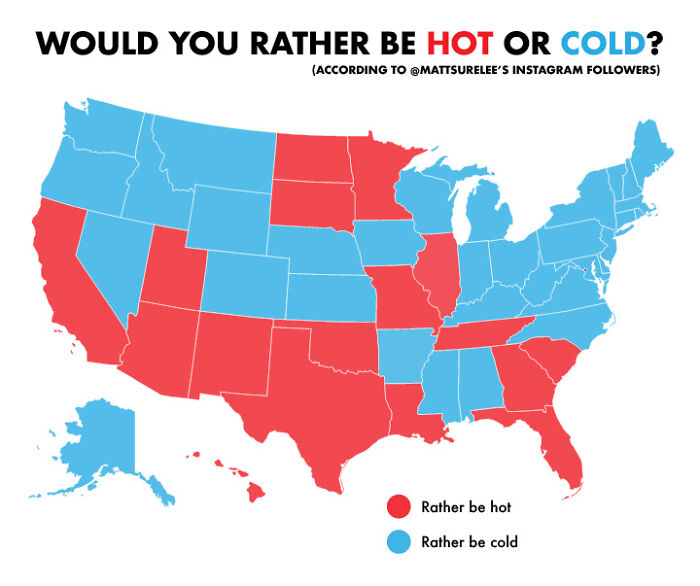
Would You Rather Be Hot Or Cold?
Neither, I would rather be warm. Even though I hate the cold at least you can keep putting layers on to warm up. Unlike the heat, there is only so much you can take off. Humidity is even worse.
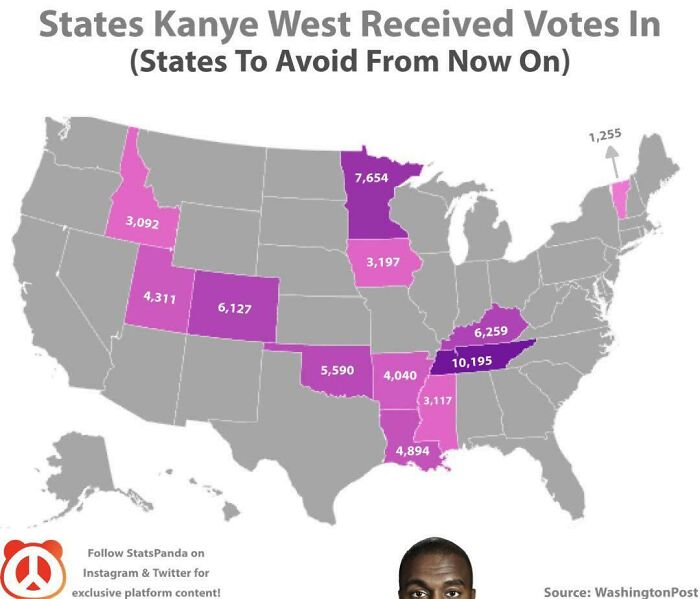
States Kanye West Received Votes In
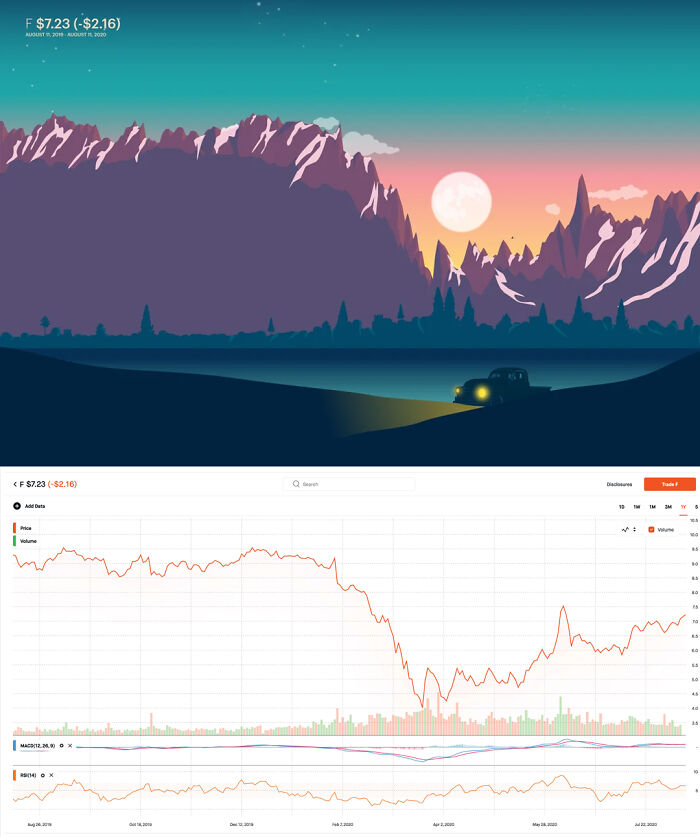
I’ve Been Taking Stock Market Chart And Turning Them Into Landscape Art. An Alternative And Simple Explanation Of The Pandemic Affect These Companies. This One A Years Snapshot Of Ford
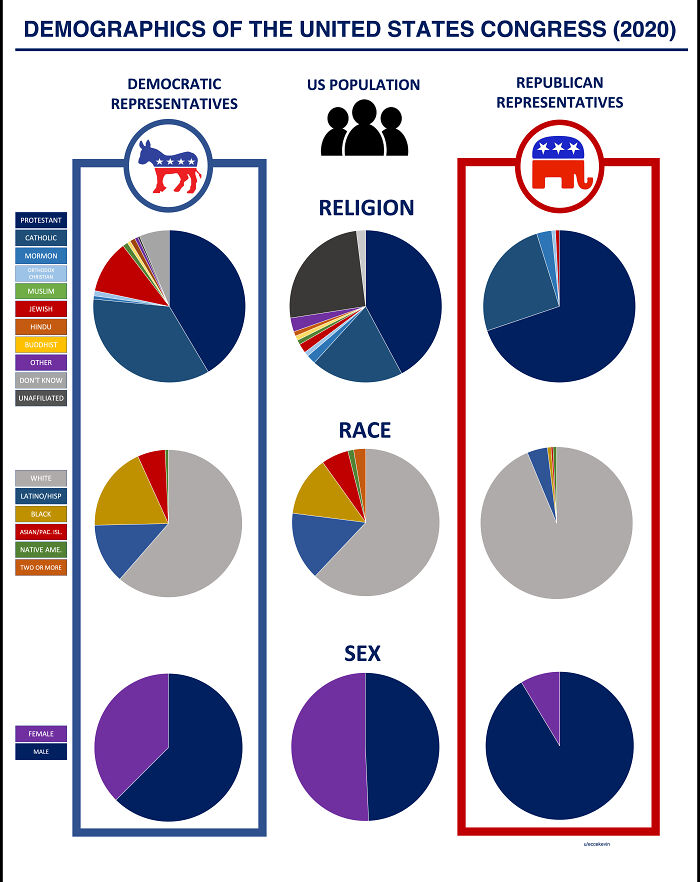
How Representative Are The Representatives? The Demographics Of The U.S. Congress, Broken Down By Party
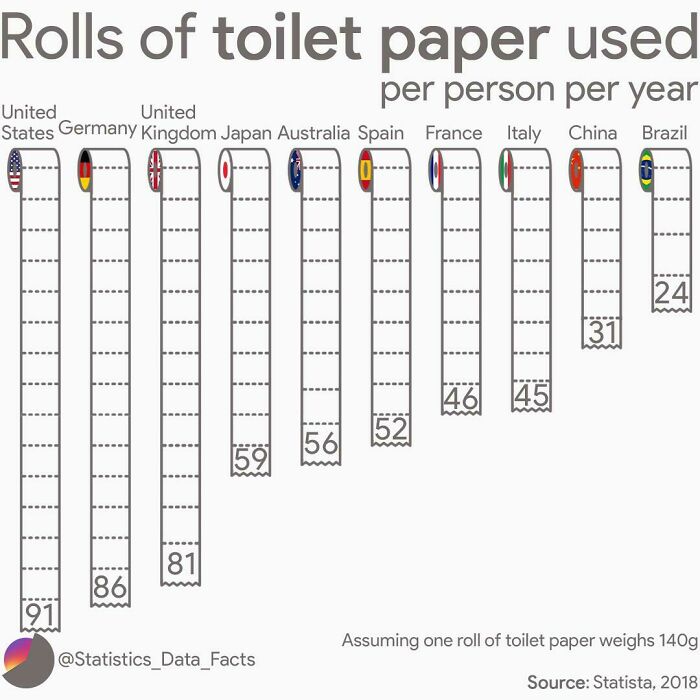
Rolls Of Toilet Paper Used Per Person Per Year
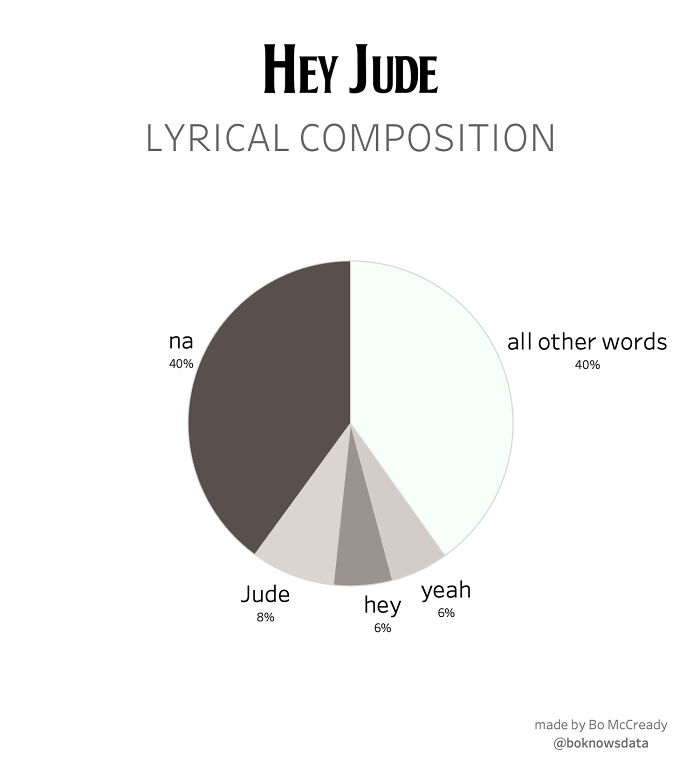
Hey Jude Lyrical Composition
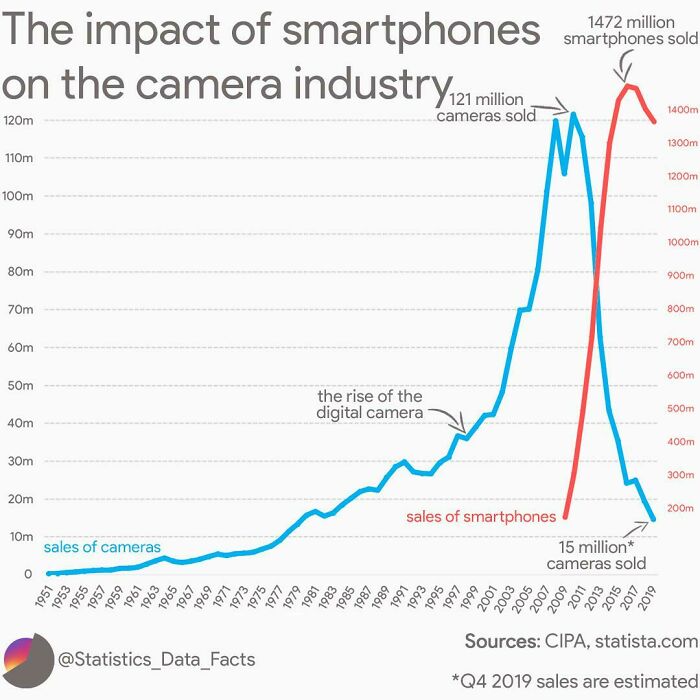
The Impact Of Smartphones On The Camera Industry
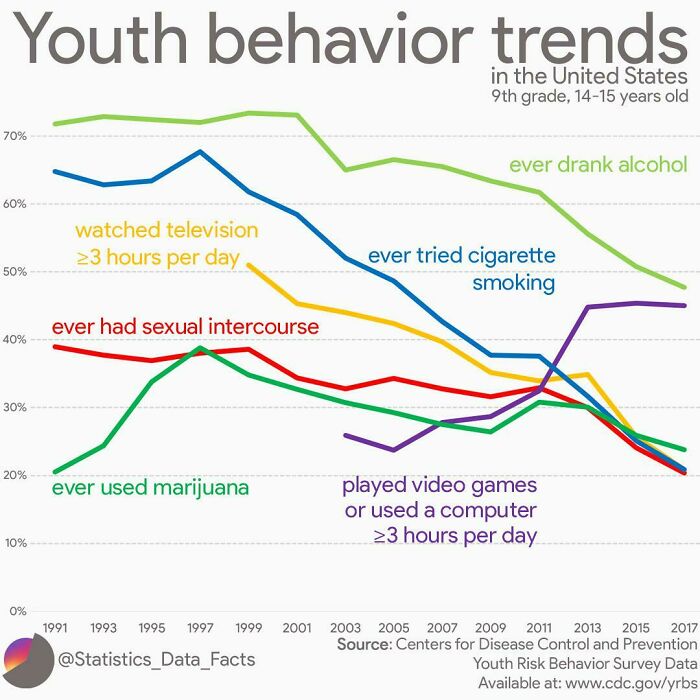
Youth Behavior Trends In The United States, 9th Grade, 14-15 Years Old
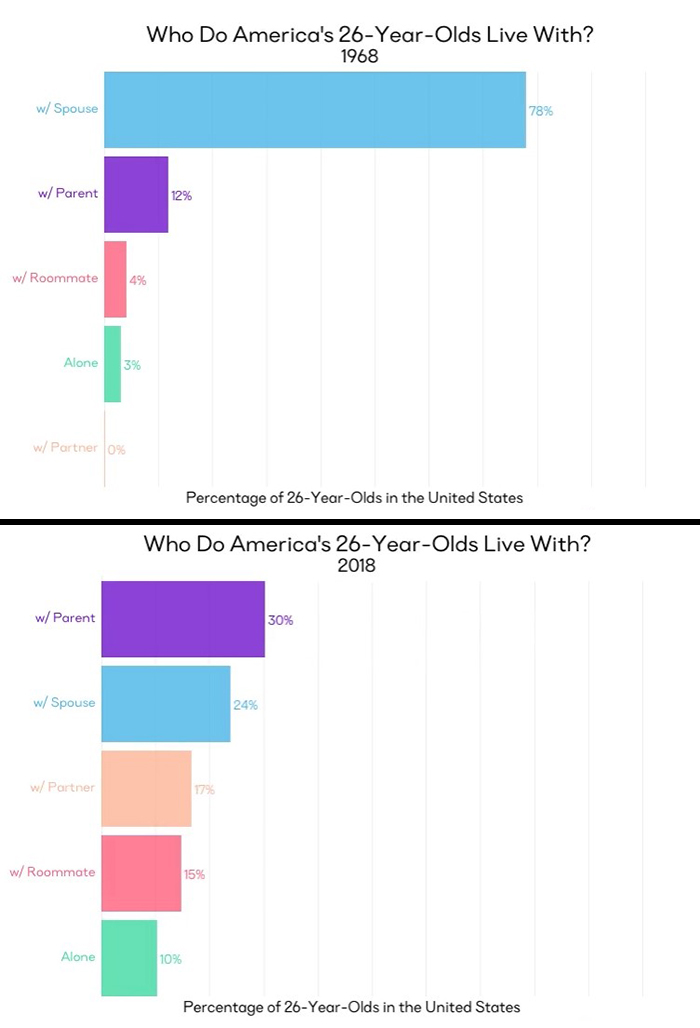
In America, Young Adults Are Now More Likely To Live With Parents Than Spouses
Leonardo Dicaprio Refuses To Date A Woman His Age [oc]
Why would I care? Neither is it my life nor am I affected by it. Some people like when their partners are older than them, some prefer younger. Actually, while being in my twenties, I am mostly attracted to men around 40. It seems all of his girlfriends started relationships with him out of their own free will. As long as both sides are okay with this (and they apparently were), who am I to criticize?
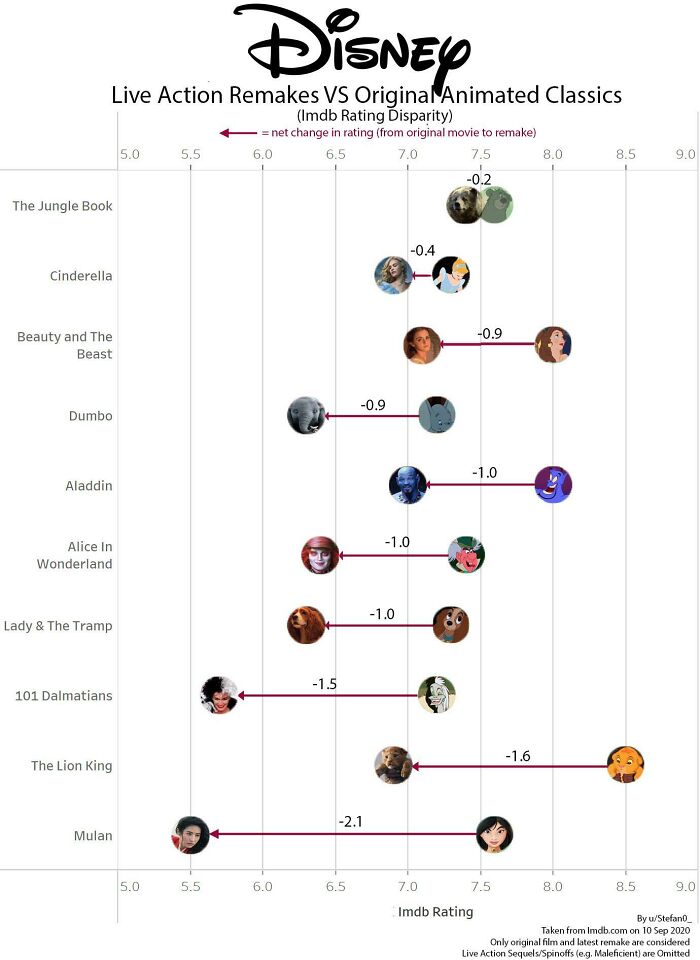
Ratings Of Disney Animated Classics vs. Live Action Remakes
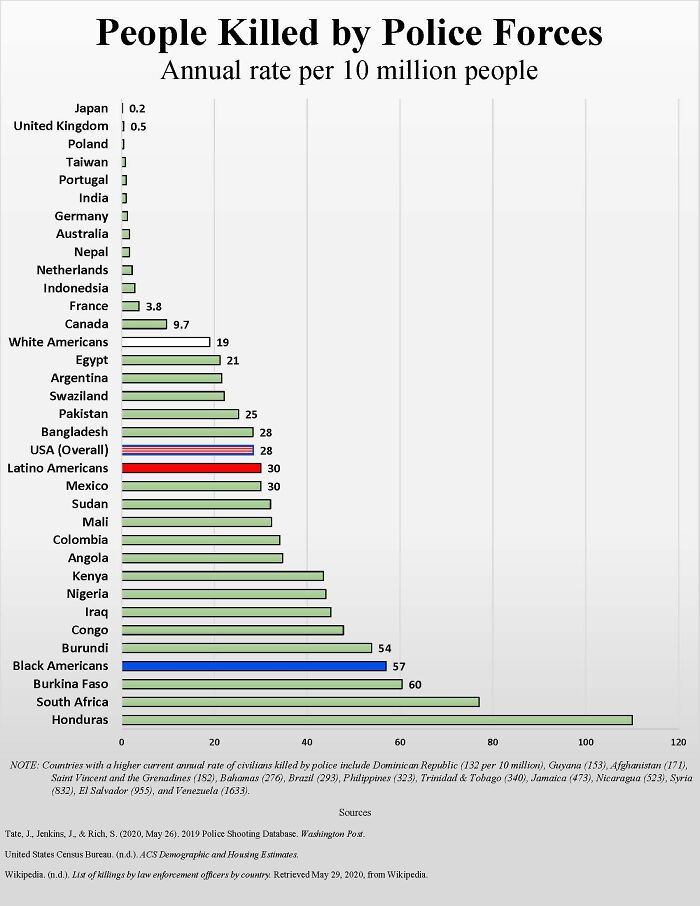
People Killed By Police Forces (Annual Rate Per 10 Million People)
Trending Google Searches By State Between 2018 And 2020
I Recorded My Travels As A Professional Truck Driver Since 2012
Rna Sequence Of Covid19. This 8kb Of Data Is Responsible For All The Chaos Out There
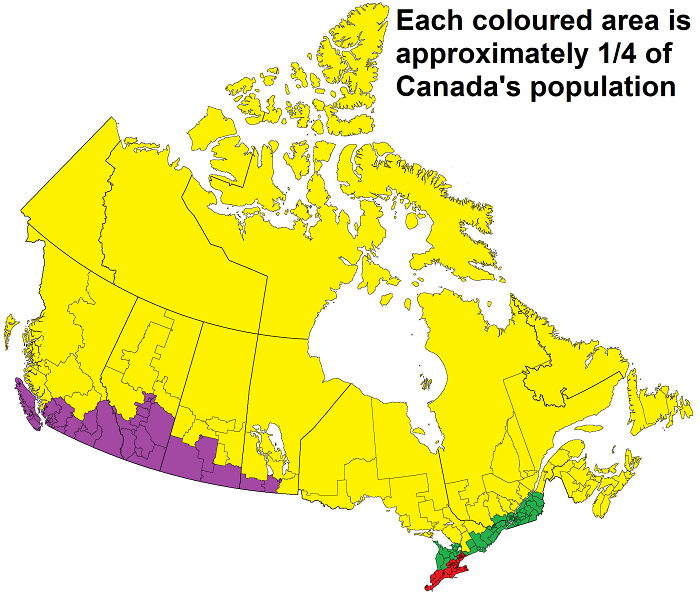
Population Distribution In Canada
Let's Hear It For The Lurkers! The Vast Majority Of Reddit Users Don't Post Or Comment
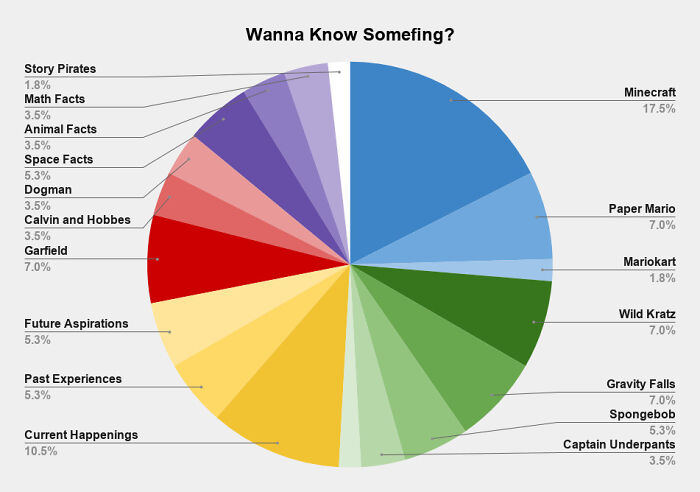
What I'm About To Learn About After My Kid Says, "Wanna Know Somefing?" Data Collected Over The Course Of 7 Days
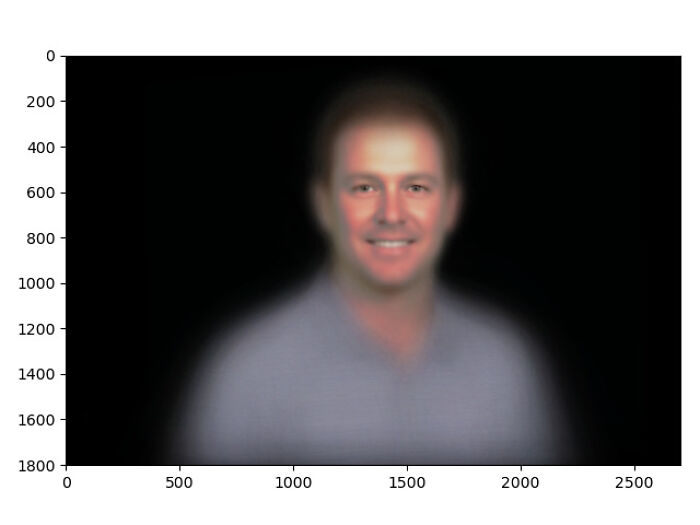
Combined Faces Of Top 500 Professional Golfers
For some reason, I find think hilarious. Yup! He looks like a golfer to me.
I Analysed 70 Years Of Baby Names In The Us To Decide What To Call A Male Karen. It's Terry
I Got Annoyed With FedEx And Created A Visualization Of My Package's Journey
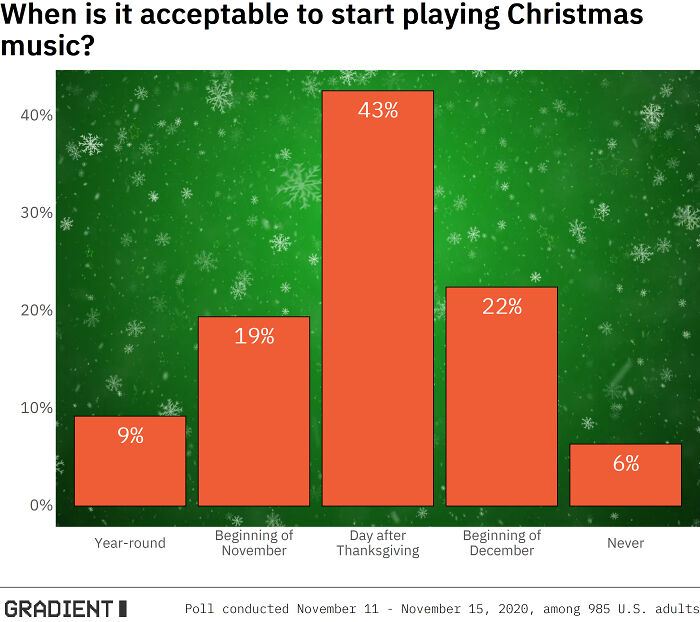
When Is It Acceptable To Start Playing Christmas Music?
Us Covid Death Toll Visualisation With Coffins And White House
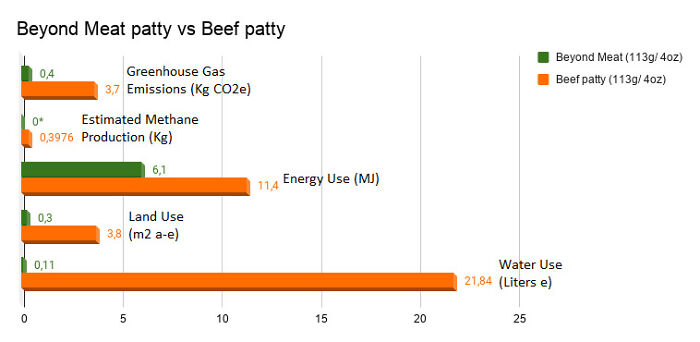
The Environmental Impact Of Beyond Meat And A Beef Patty
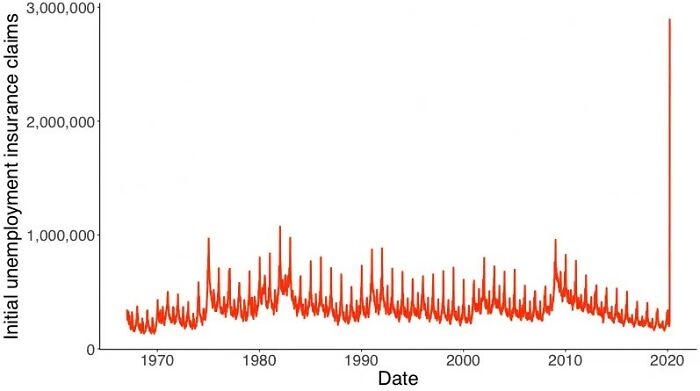
To Show Just How Insane This Week's Unemployment Numbers Are, I Animated Initial Unemployment Insurance Claims From 1967 Until Now. These Numbers Are Just Astonishing
I Made This Blanket. It's The Daily High/Low Temperatures For Denver In 1992
I've never seen it done this way before! I like it a lot like this,
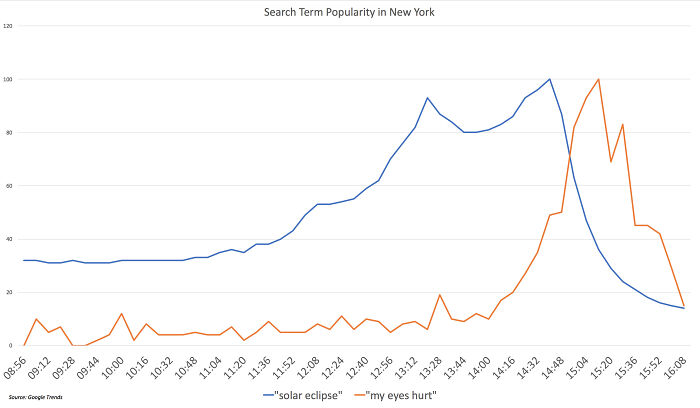
"My Eyes Hurt"
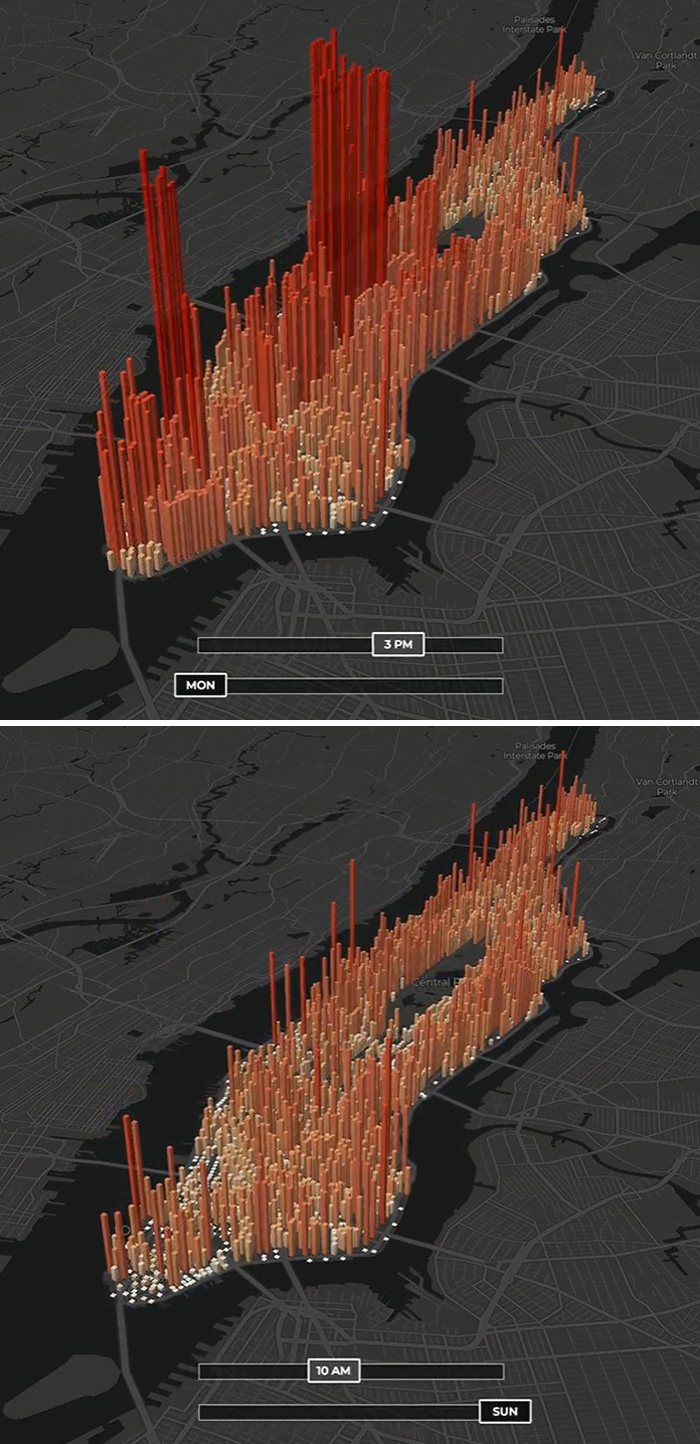
The City Is Alive: The Population Of Manhattan, Hour-By-Hour
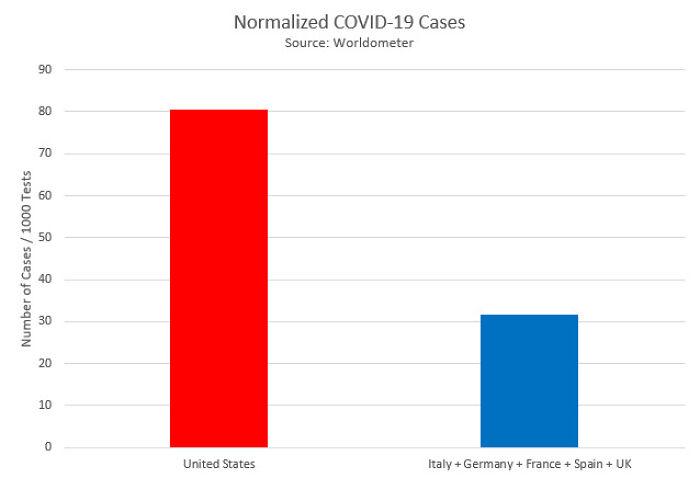
My Attempt To Graphically Combat The Idea That U.S. Has More Cases Because We Test More
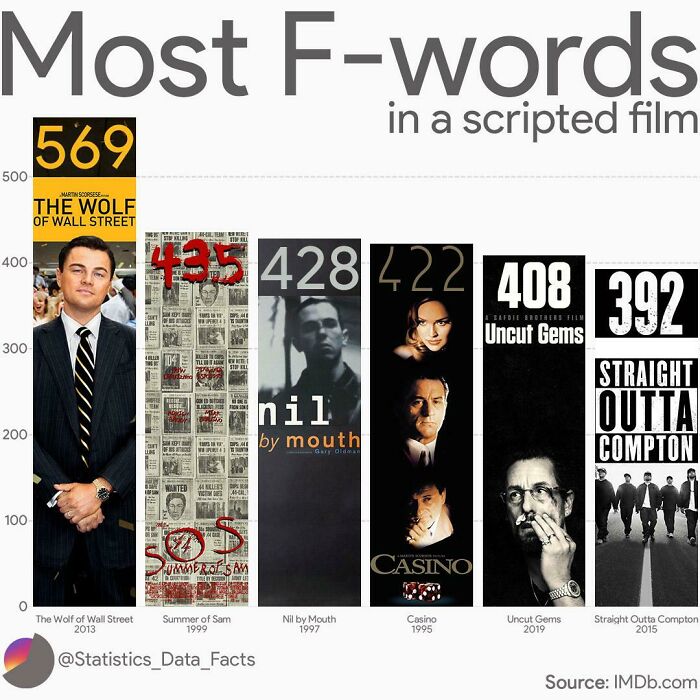
Most F-Words In A Scripted Film
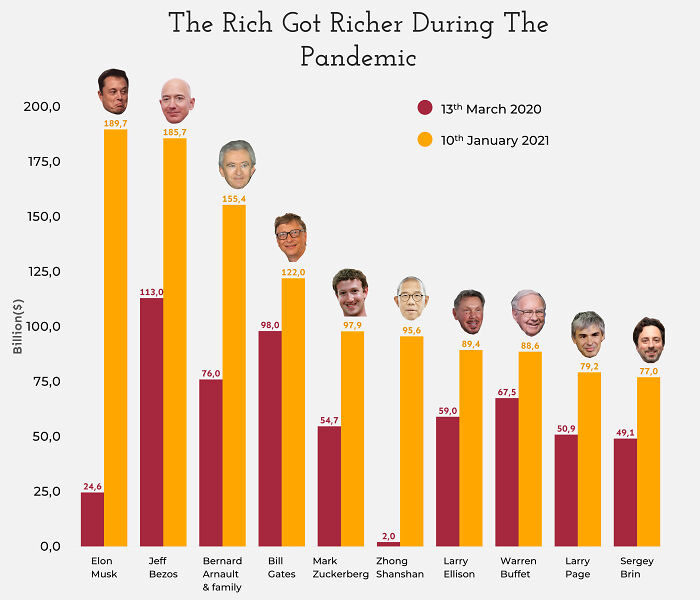
Net Worth Comparison Of The Top 10 Richest Person In The World In March 2020 And January 2021
And if everyone of these donated just half of their money then we could reduce famine, homelessness drastically, maybe even get rid of them completely.
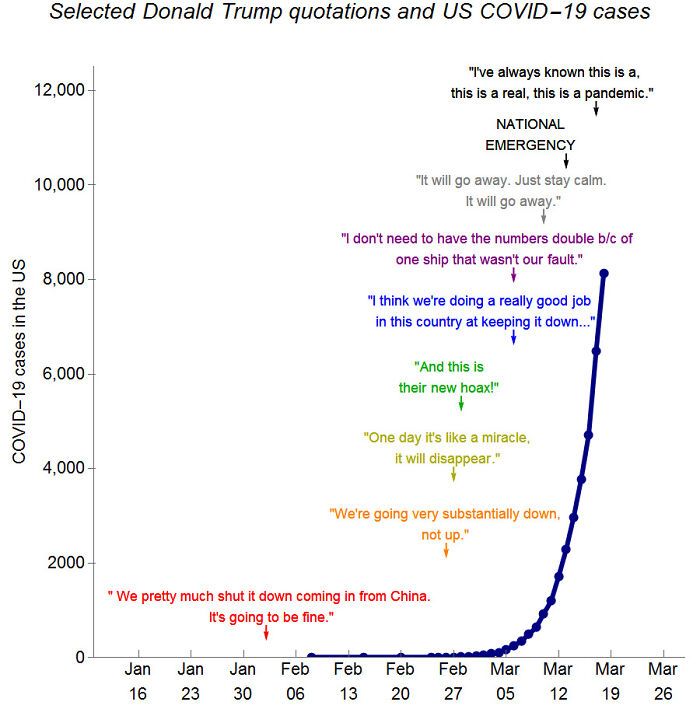
A Plot Of Covid-19 Cases With Quotes From The President Superimposed. Data From Wikipedia/Jhu And Snopes. Made With Mathematica
10 Years Of Tesla Stock Prices
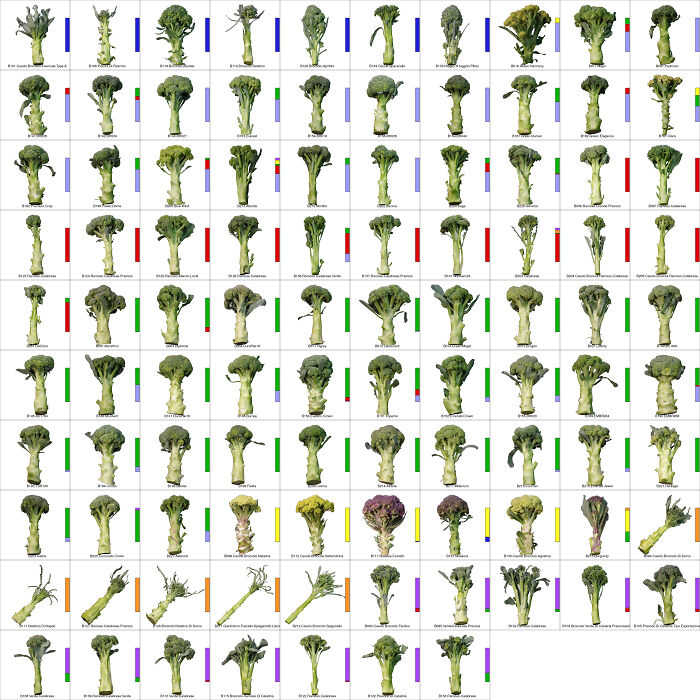
I Grew 97 Different Types Of Broccoli This Summer And Visualized Their Biological Diversity
I am shocked that there are 97 or more types of broccoli.
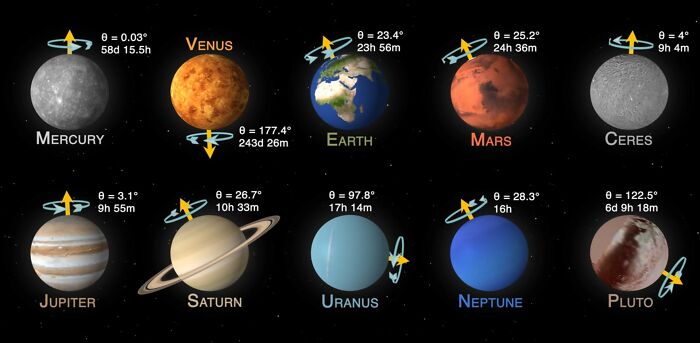
Relative Rotation Rates And Axial Tilts Of (The Only) Mapped Planets And Dwarf Planets
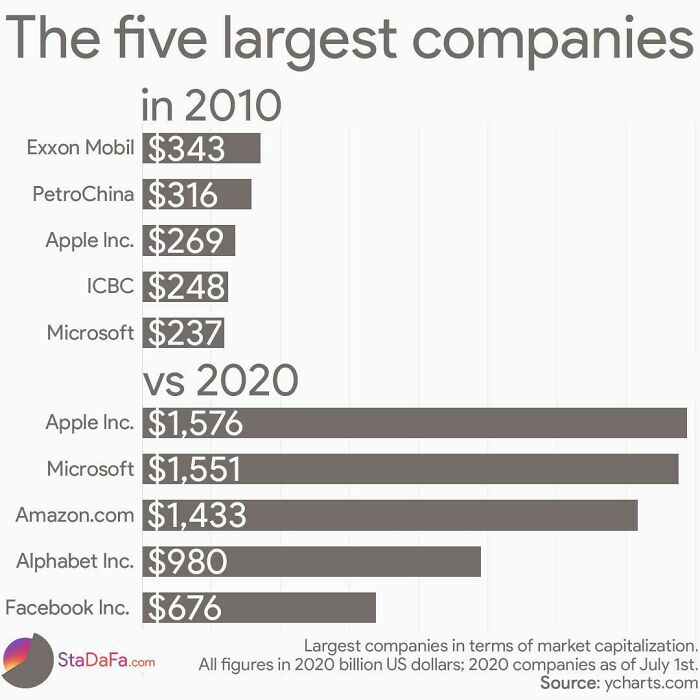
The Five Largest Companies In 2010 vs. 2020
Alphabet is the owner of Google for those who didn't know. I... googled that...
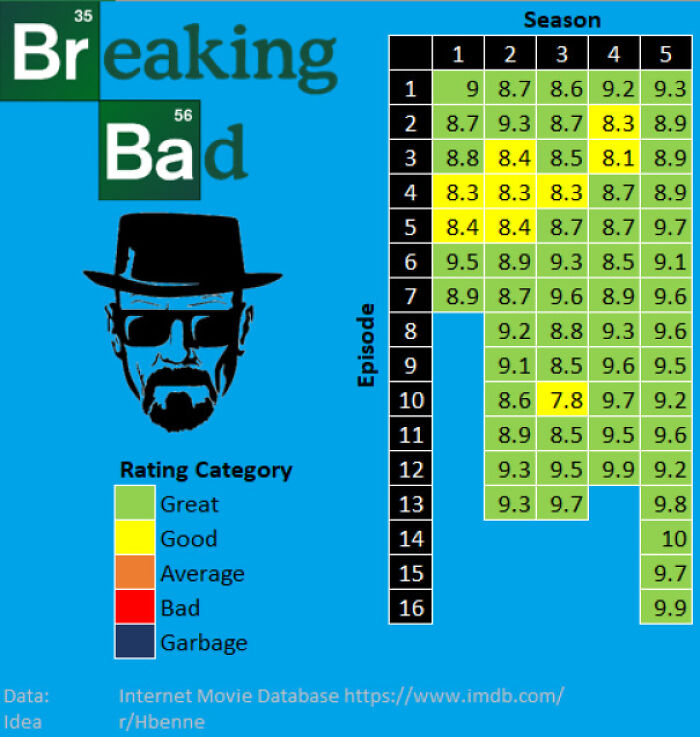
The Absolute Quality Of Breaking Bad
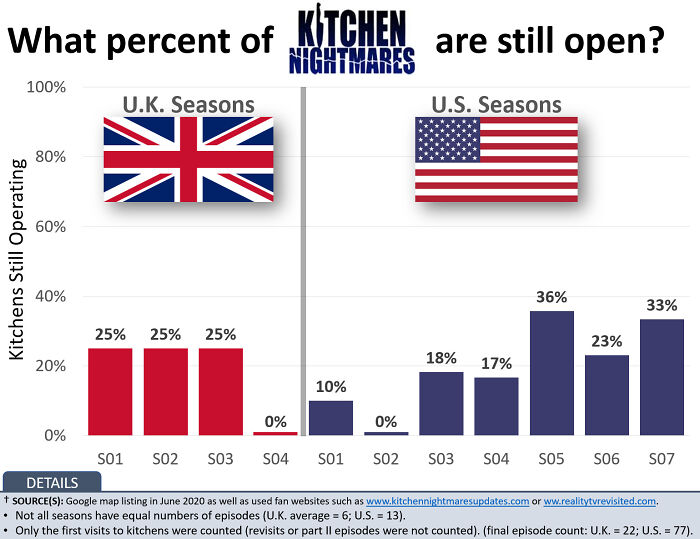
What Percent Gordon Ramsay’s Kitchen Nightmares Are Still Open?
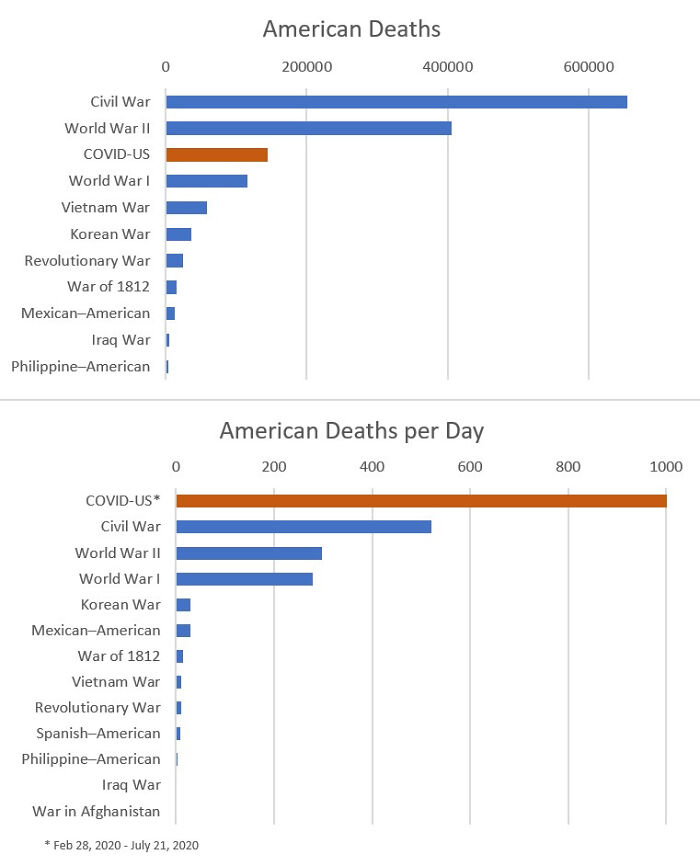
American War Casualties + Death Rate Compared With American Covid Deaths
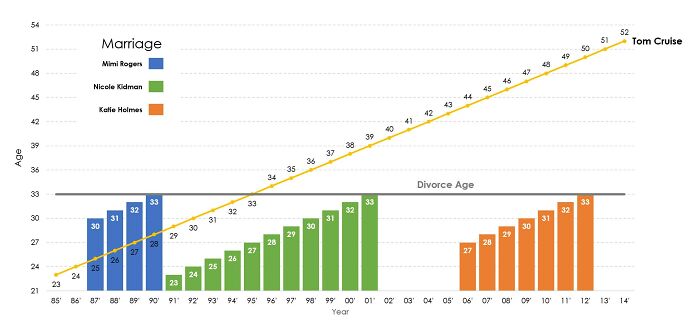
All Tom Cruise's Wives Were 33 At Time Of Divorce...
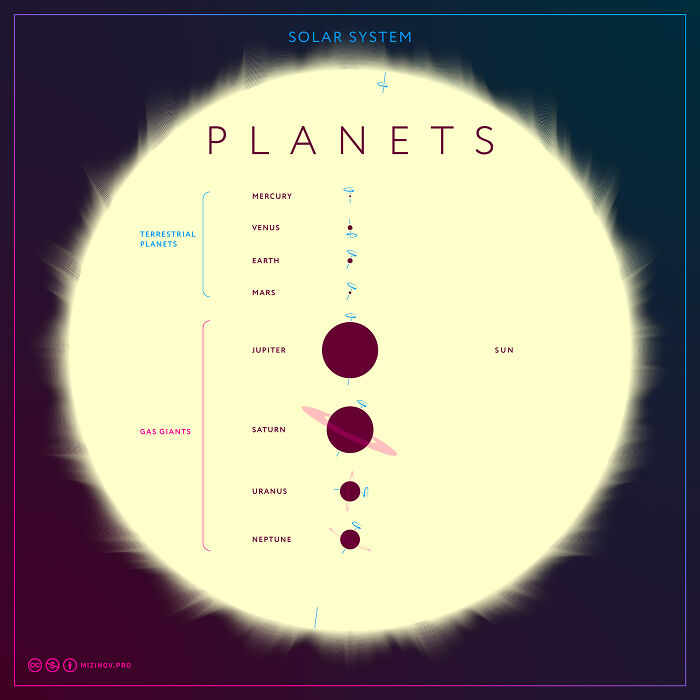
Solar System Planets Size
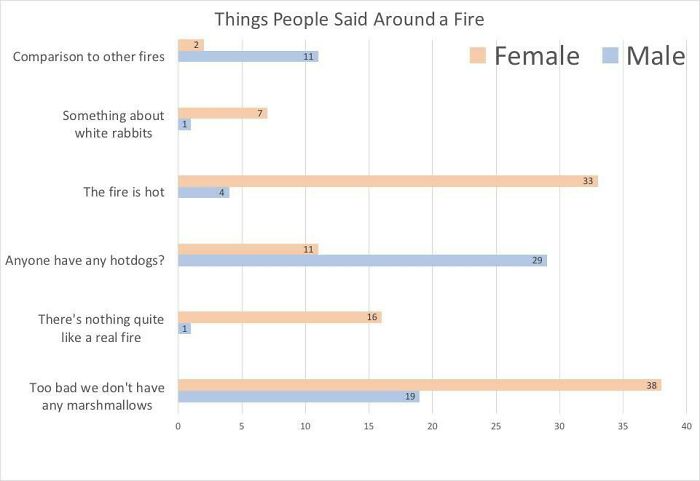
I Sat By A Fire And Recorded What People Said
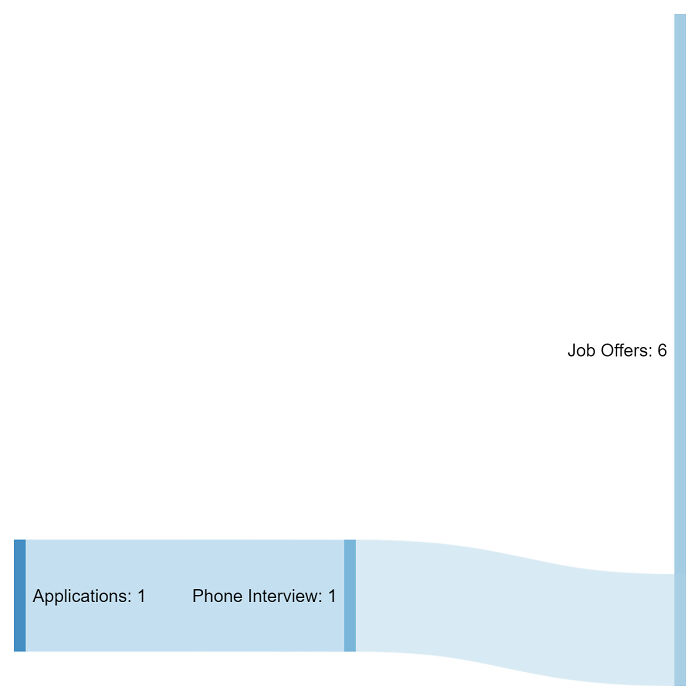
Result Of 6 Days Of Job Hunting As An Experienced Icu Nurse Searching For A Travel Nurse Contract
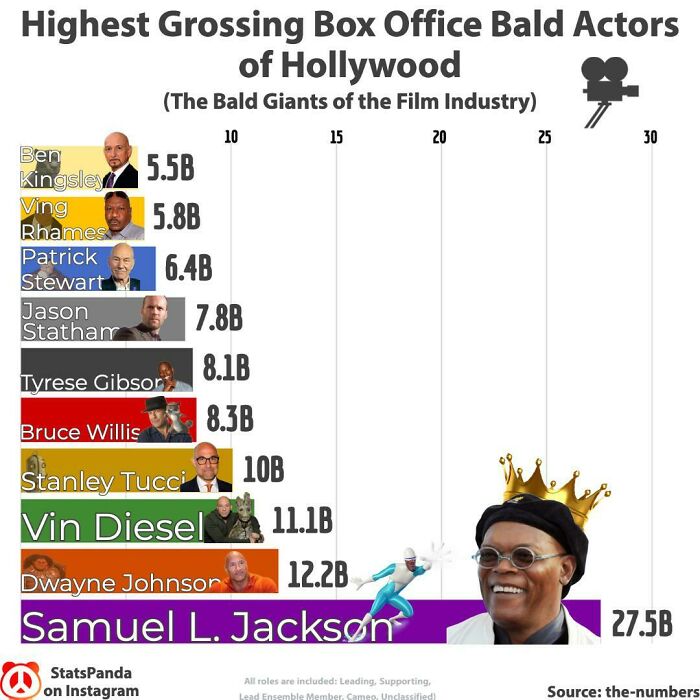
Highest Grossing Box Office Bald Actors Of Hollywood
Density Map Of Stars On National Flags
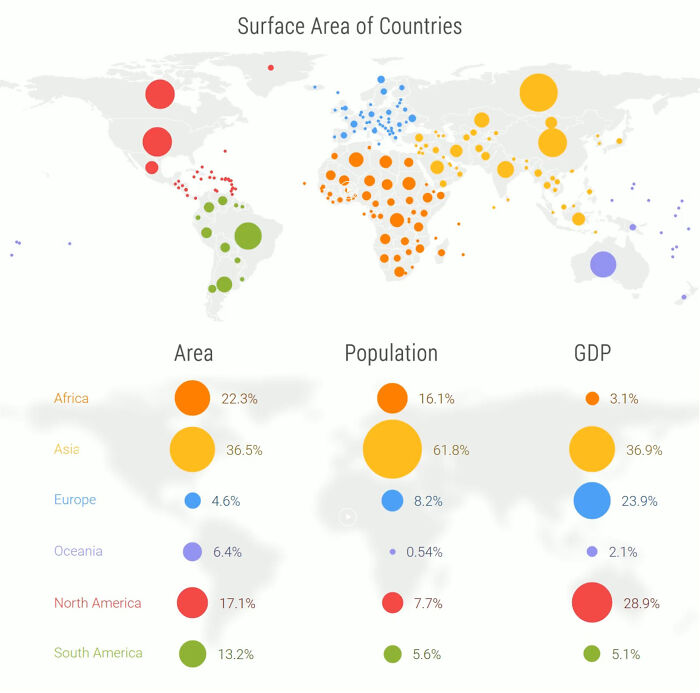
Continents & Countries Compared
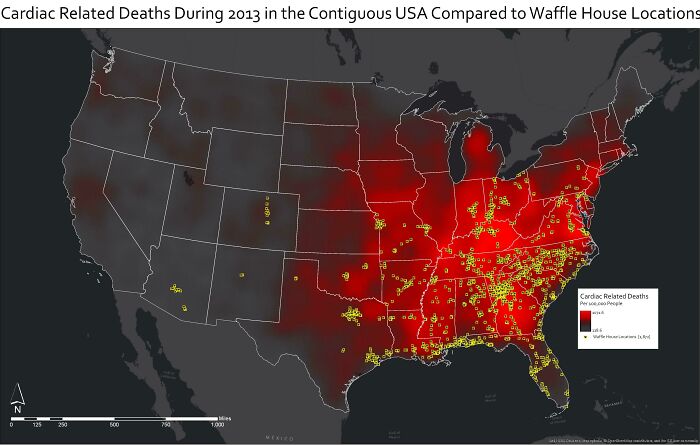
Cardiac Related Deaths During 2013 In The Contiguous USA Compared To Waffle House Locations
The Great Pacific Garbage Patch
My Daughters Sleeping Patterns For The First 4 Months Of Her Life. One Continuous Spiral Starting On The Inside When She Was Born, Each Revolution Representing A Single Day. Midnight At The Top (24 Hour Clock)
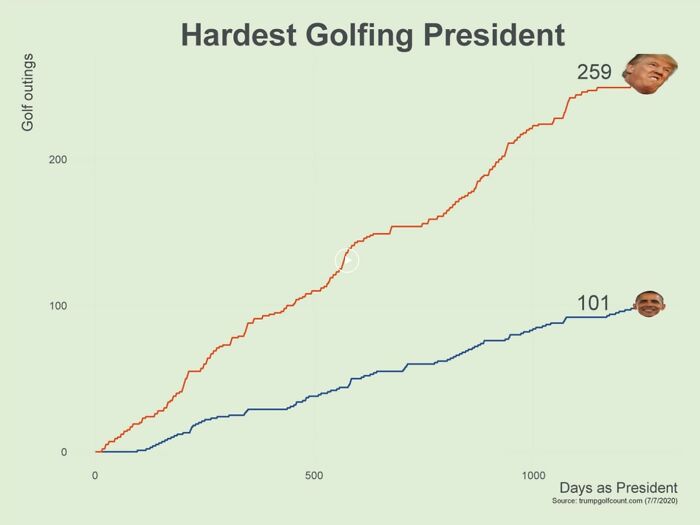
Hardest Golfing President
Another thing to bear in mind is that Obama usually golfed at military installations hear DC. Since presidents need a large security team, that was much less expensive to the government than flying them to private golf resorts. Not to mention the fact that Trump often flew to his own golf resorts making the government pay his companies to accommodate his entourage.
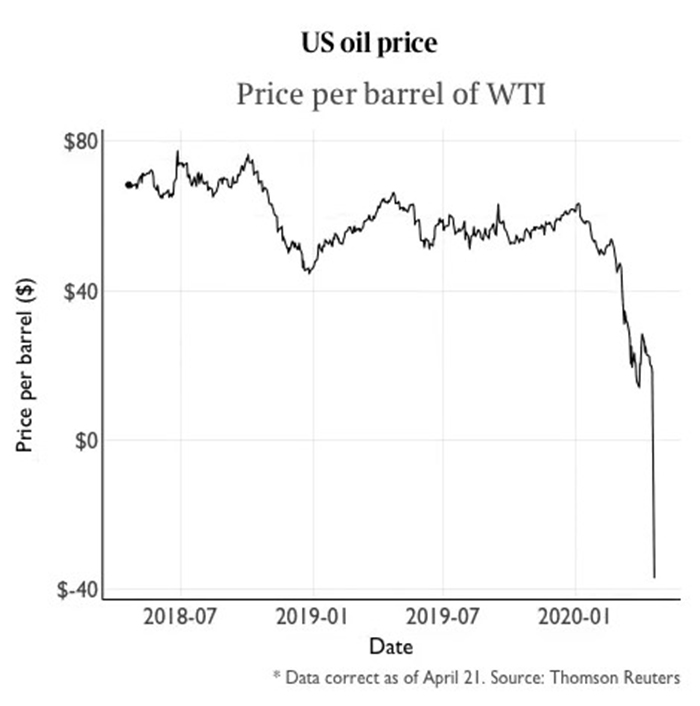
Us Oil Price
I Cycled Through All The Streets Of Central London
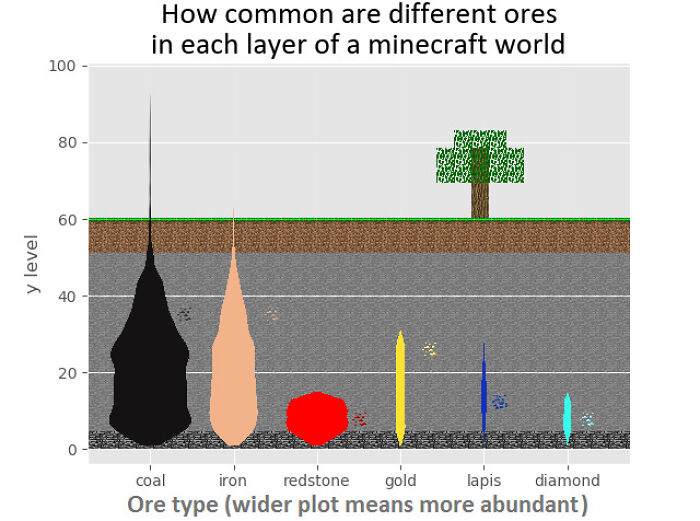
Where Is Each Ore Found In A Minecraft World?
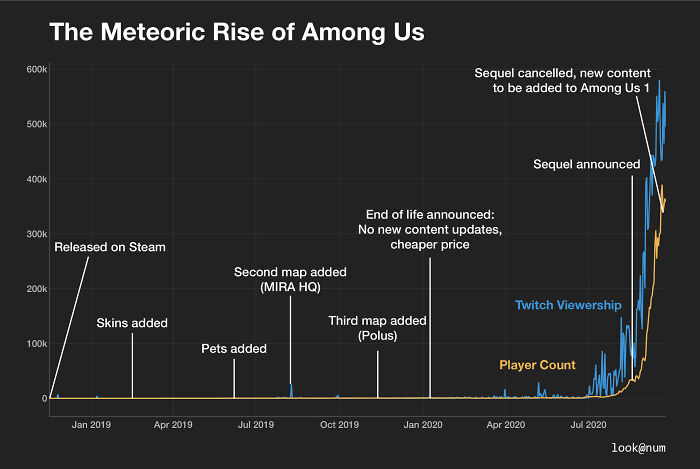
The Meteoric Rise Of Among Us: How A 2 Year Old Game Became Viral Overnight
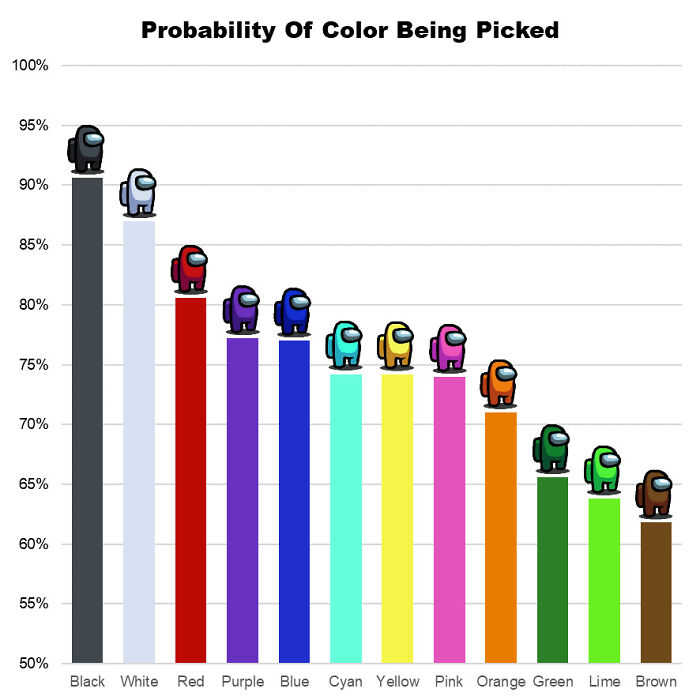
Most Popular Colors In Among Us
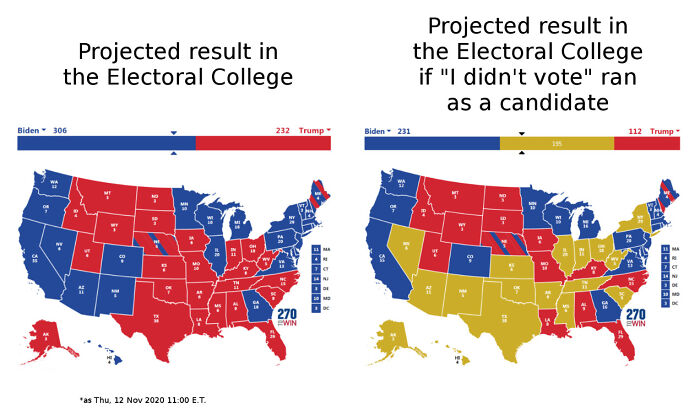
What If "I Didn't Vote" Ran As A Us Presidential Candidate In The 2020 Election?
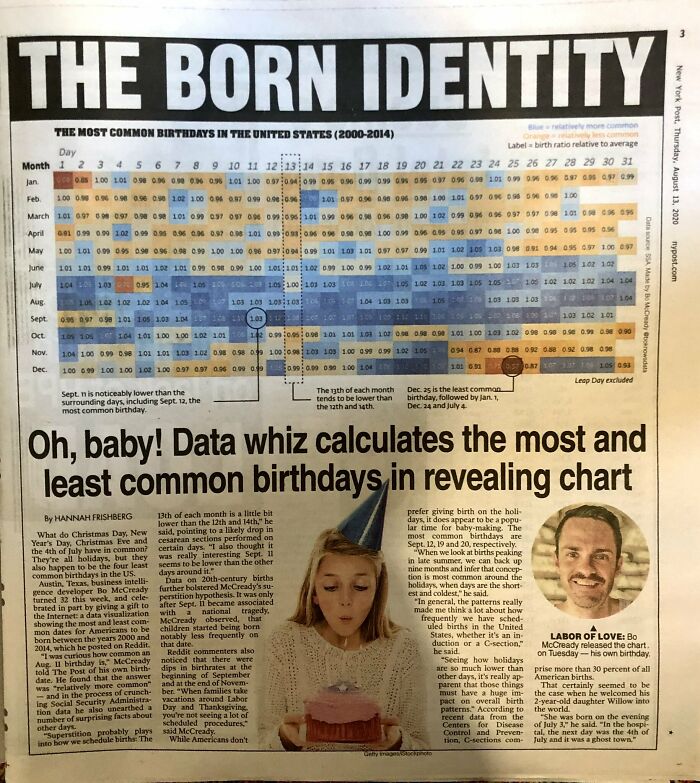
Birthday Frequency Graphic Featured In Today's New York Post
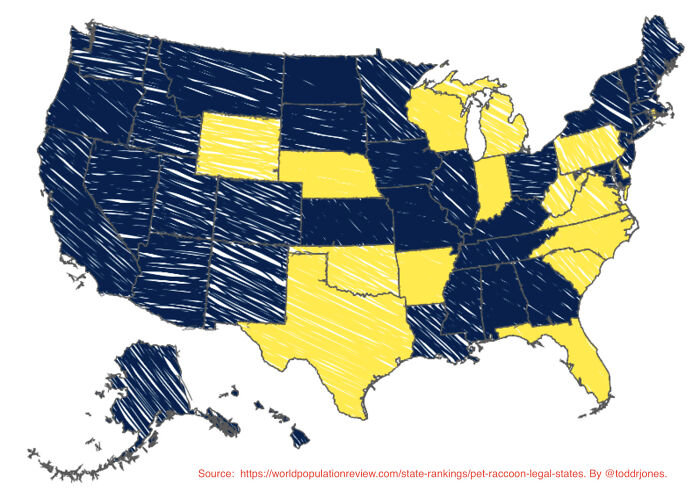
The Yellow States In The Map Below Are The States In Which It Is Legal To Own A Raccoon
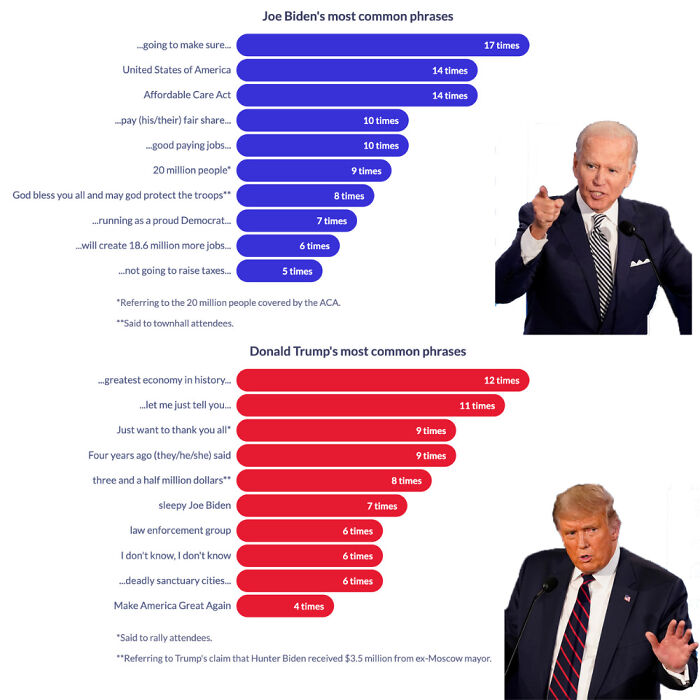
The Debate Drinking Game, According To Data Science!
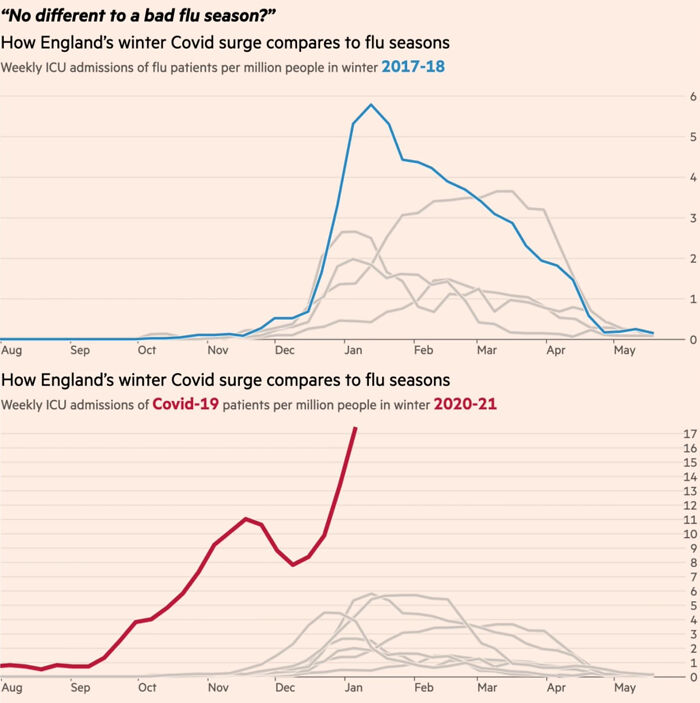
How Does Covid Compare To A Bad Winter Flu Season?
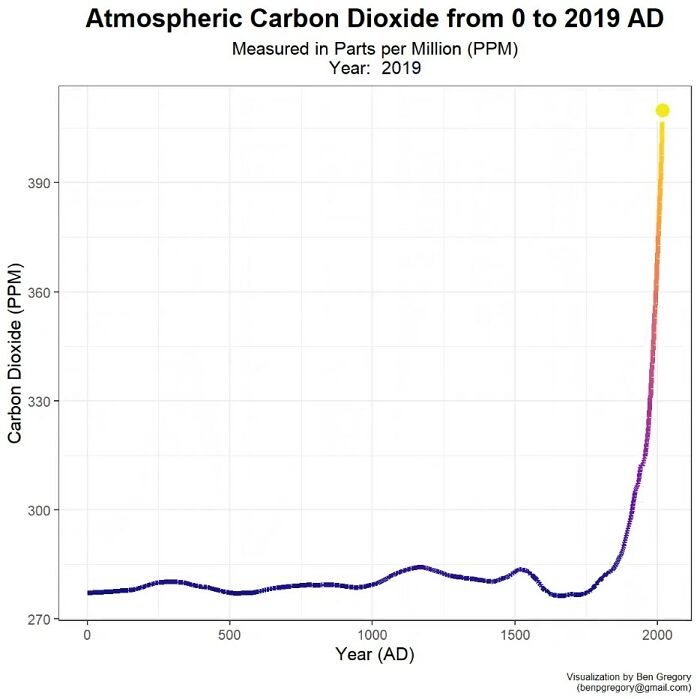
Two Thousand Years Of Global Atmospheric Carbon Dioxide In Twenty Seconds
1920 Presidential Election
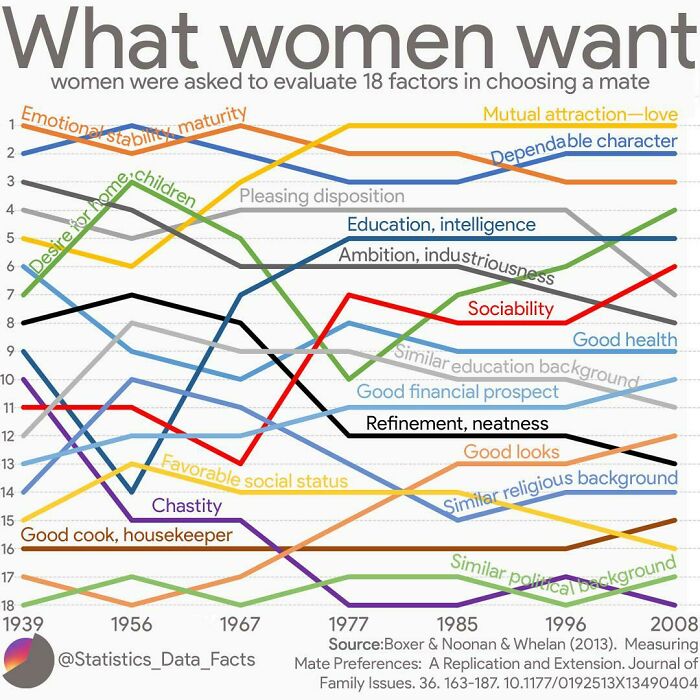
What Women Want Over The Years
Here is my list. Funny, caring, trustworthy, loyal, mutual attraction, nice eyes and love.
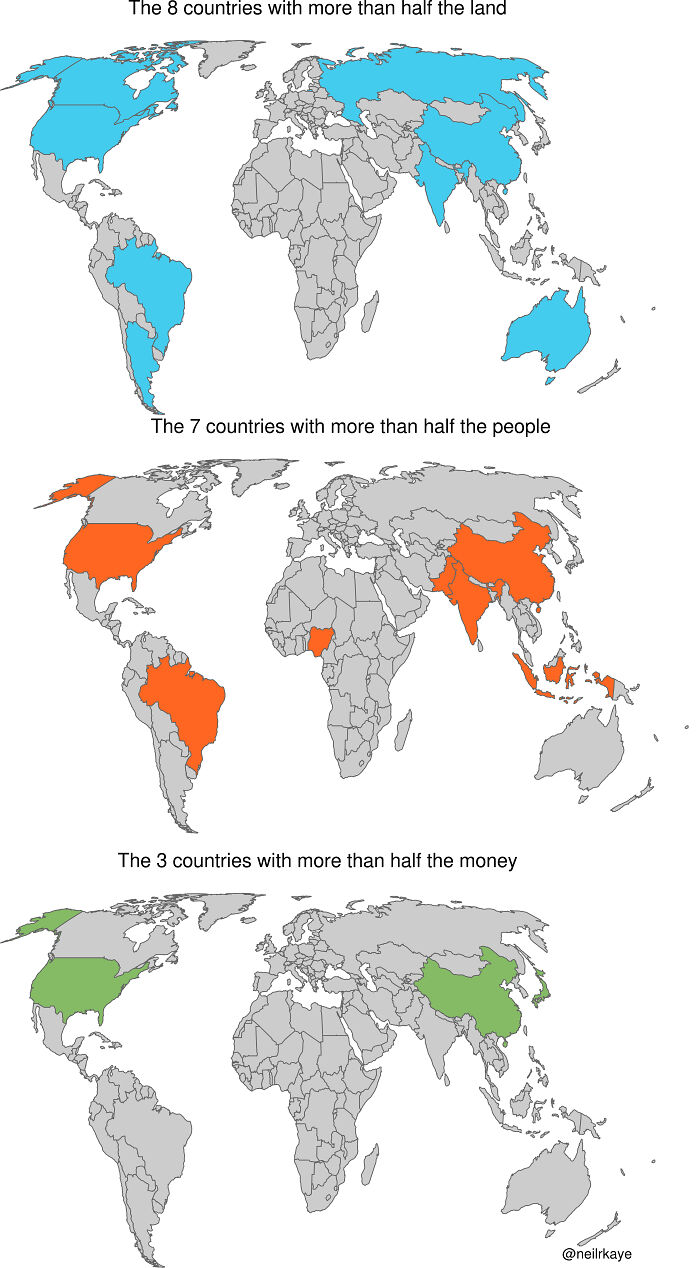
Fewest Countries With More Than Half The Land, People And Money
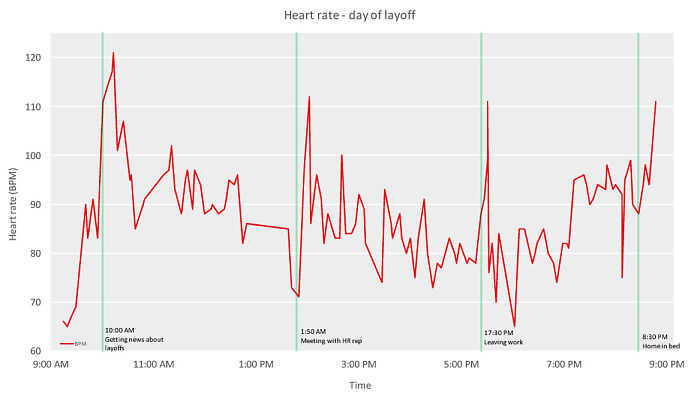
Heart Rate During Layoff
USA Covid Cases Syringe
The Seuss Syringe: The Cure to The Deadly Disase of the Thingamajigger (Which this virus can be obtained by eating green eggs and ham)
Recorded Music Industry Revenues
I listen to cassettes on my 80's radio... I wonder if that should add a sliver to the list.
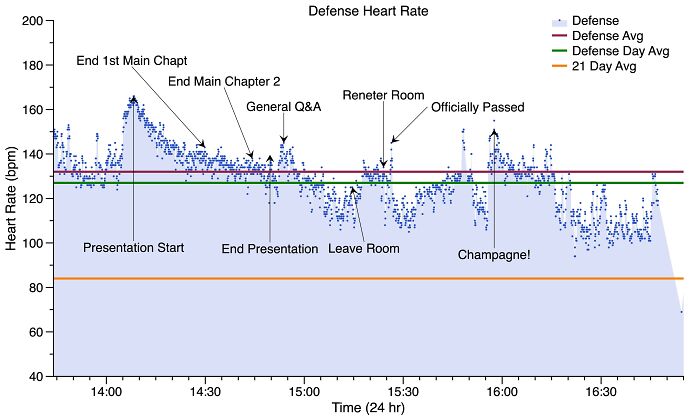
Last Week, I Defended My Dissertation And Recorded My Heart Rate During The Event
Asking 100 People For A Random Number From 1 To 10
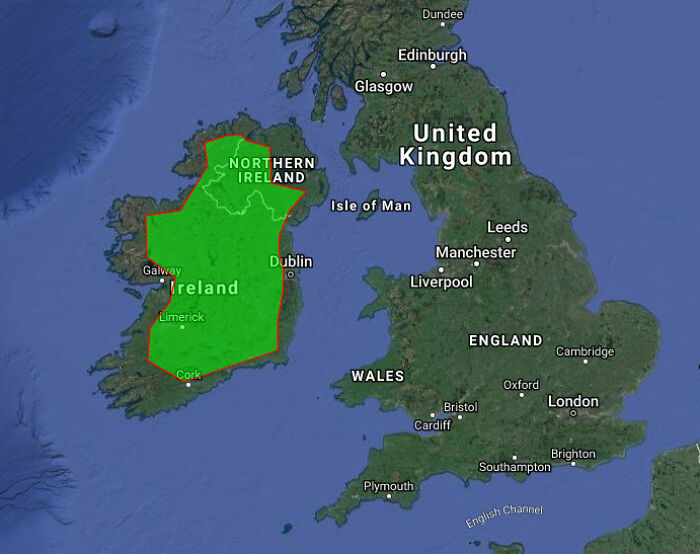
Area Of Land Burnt In Australia Compared To The Size Of Ireland
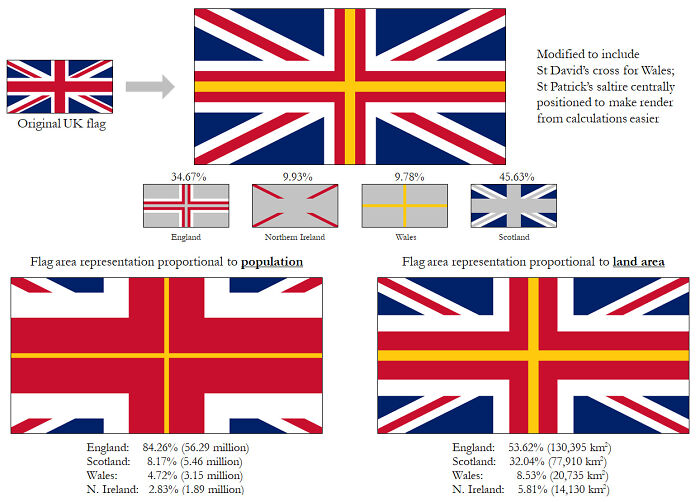
What Would The UK Flag Look Like If It Represented Its Constituent Nations Proportionally?
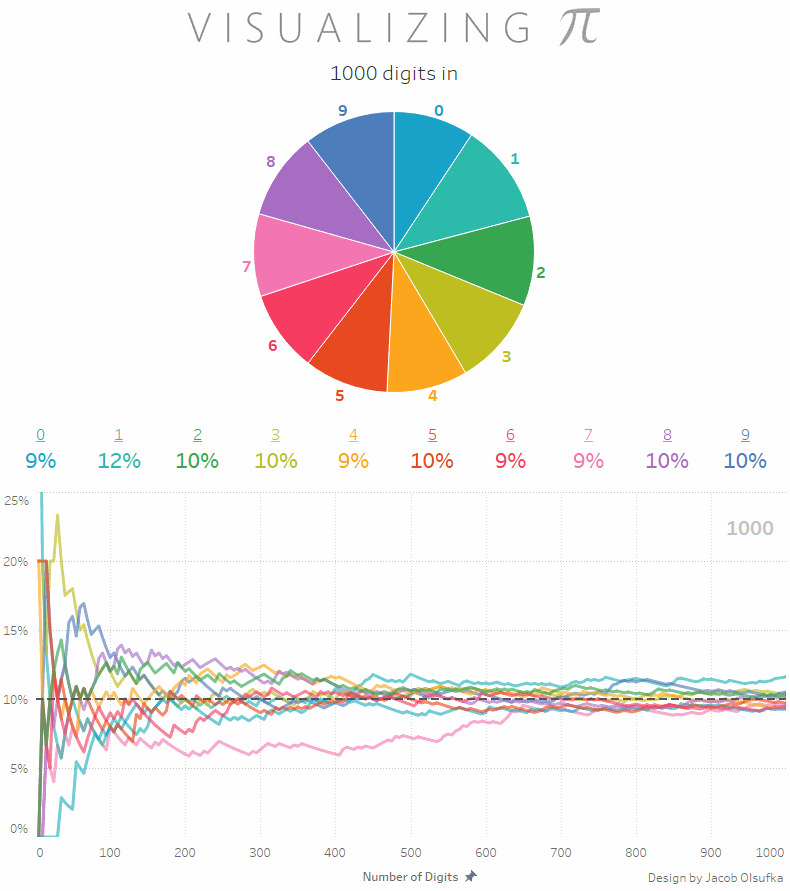
Visualizing Pi - Distribution Of The First 1,000 Digits
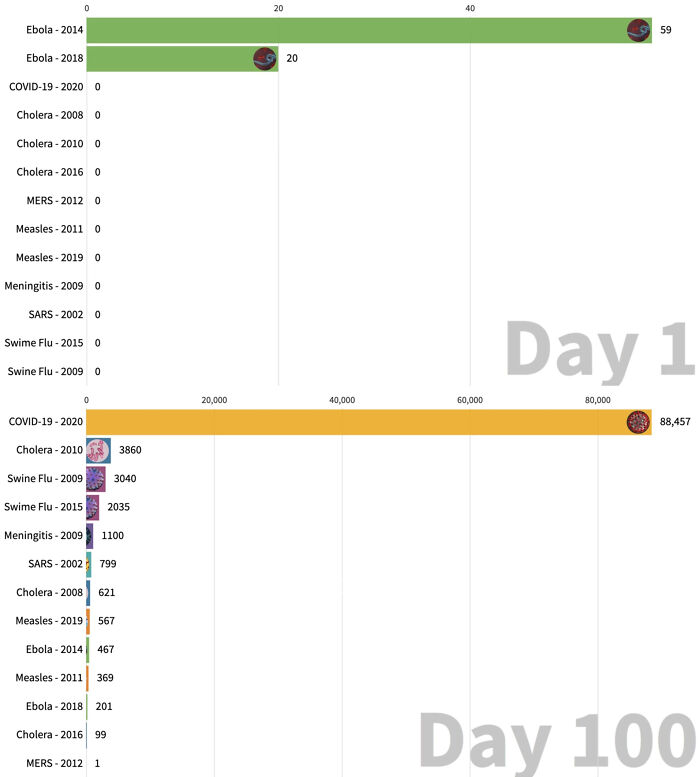
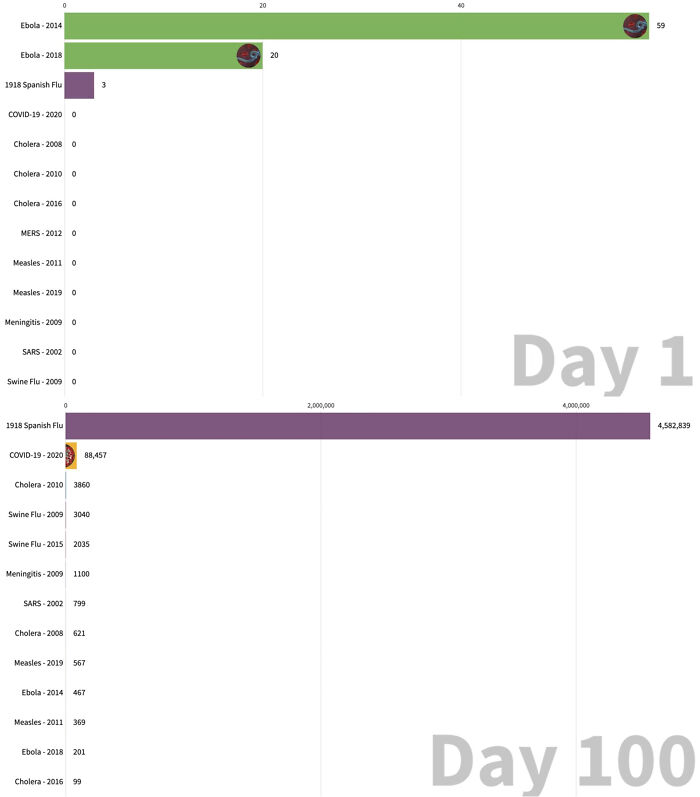
Coronavirus Deaths vs. Other Epidemics From Day Of First Death (Since 2000)
Worst Episode Ever? The Most Commonly Rated Shows On Imdb And Their Lowest Rated Episodes
I'm amazed that dexter didn't take a bigger fall the last three seasons, they were barely watchable
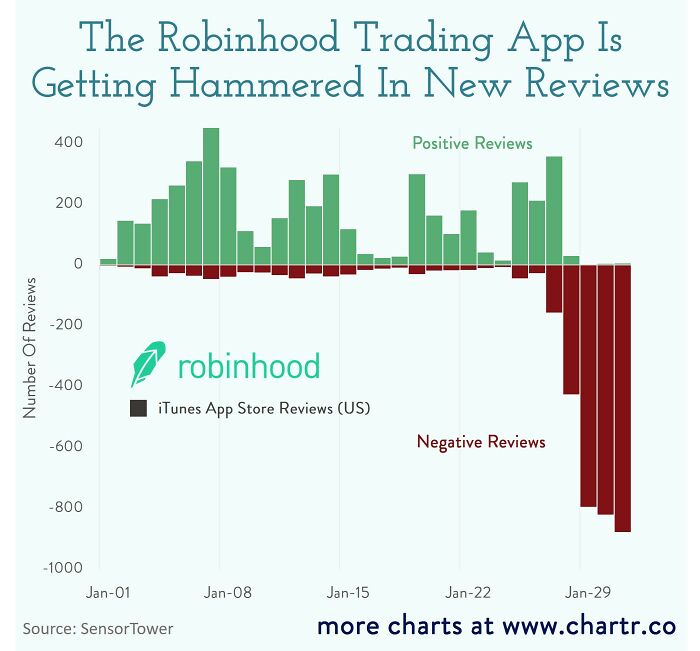
Robinhood Is Getting Wrecked In The App Store
Optimal Routes From The Geographic Center Of The U.S. To All Counties
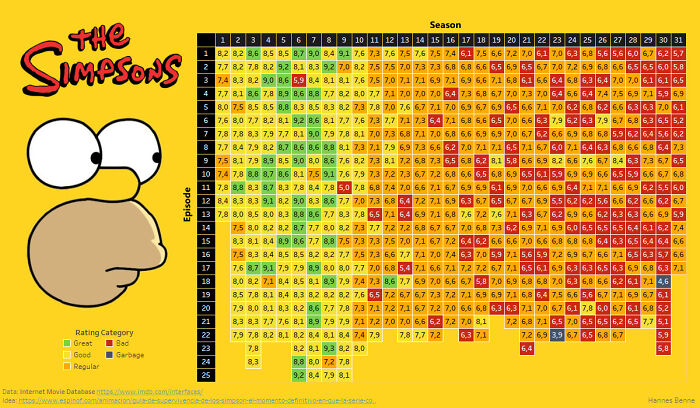
Rating Of Simpsons Episodes According To Imdb Score
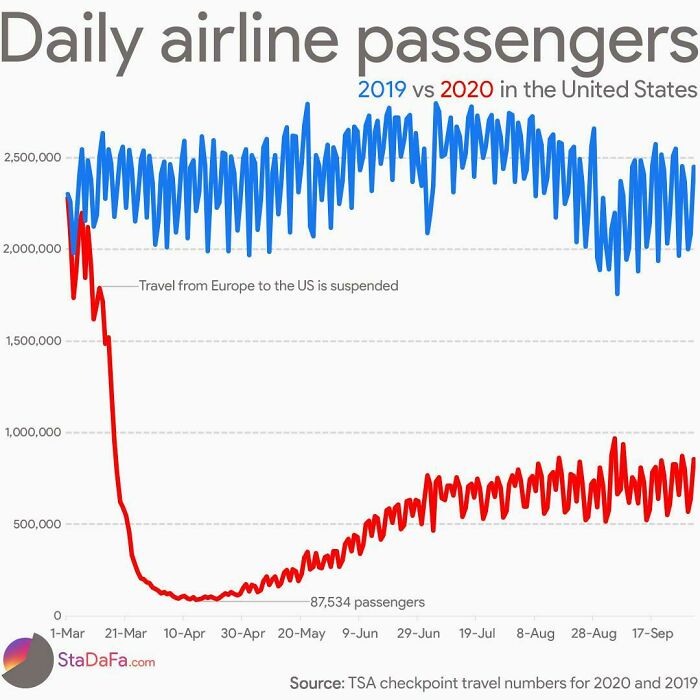
Daily Airline Passengers In 2019 vs. 2020
U/Ihatetheletterf Is A Mad Lad
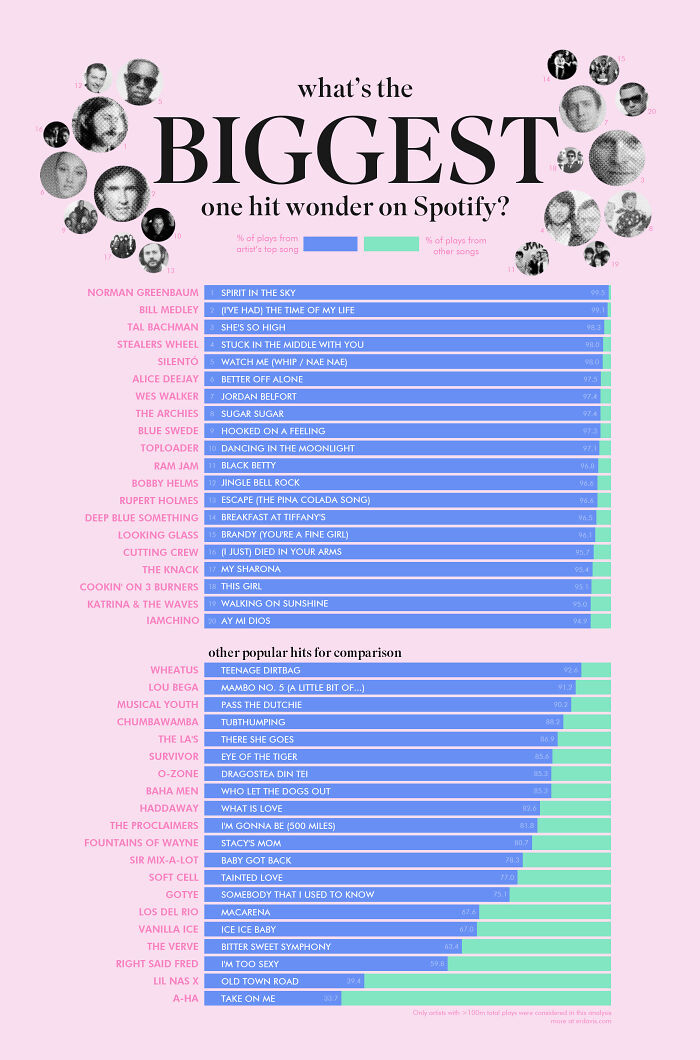
What's The Biggest One Hit Wonder On Spotify?
One Hour Of Active Satellites Orbiting Earth
Hopefully BP knows they shouldn't post screenshots of an animated GIF. That sort of ruins the effect.
Similarity In Color Palettes And Orange Between 2049 And 2020 In San Francisco
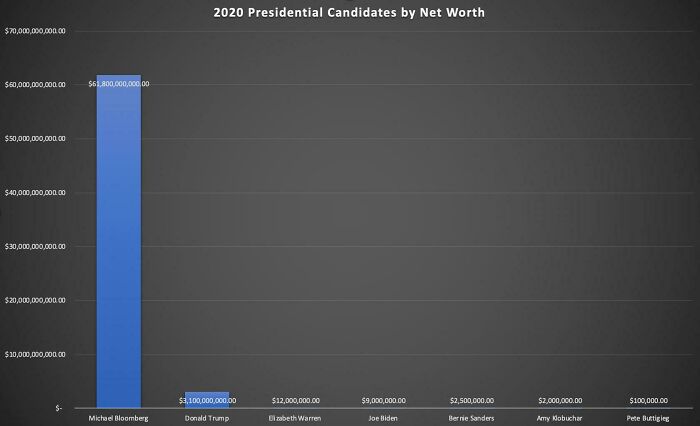
2020 Presidential Candidates By Net Worth
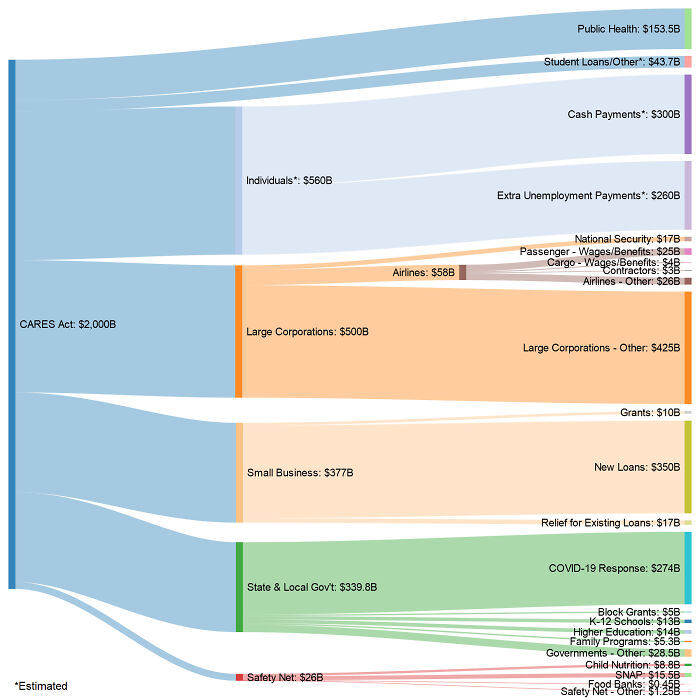
Where The Money Goes In The Us Senate's $2t Coronavirus Stimulus Bill
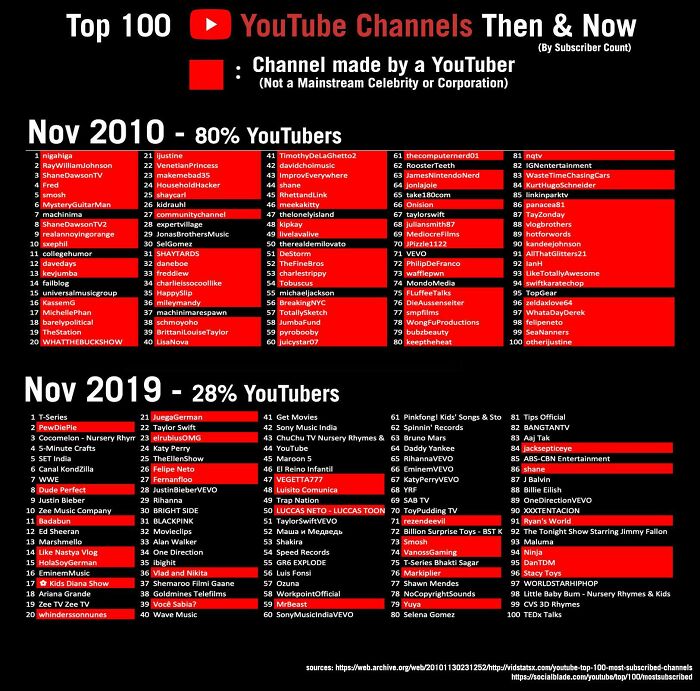
Youtube's Top 100 Most Subscribed 2010 vs. 2019
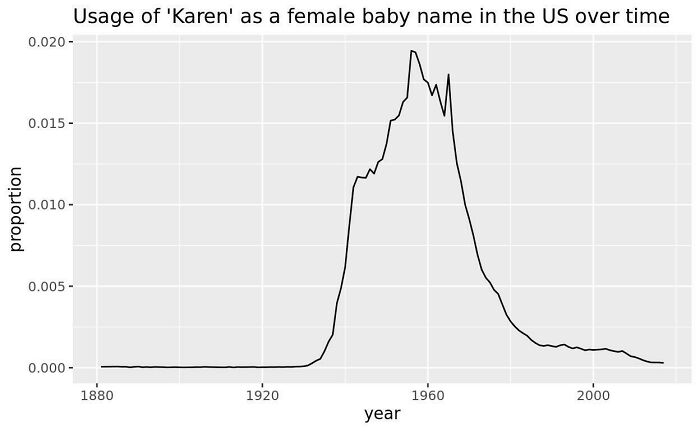
Popularity Of The Name “Karen” Over Time In The Us
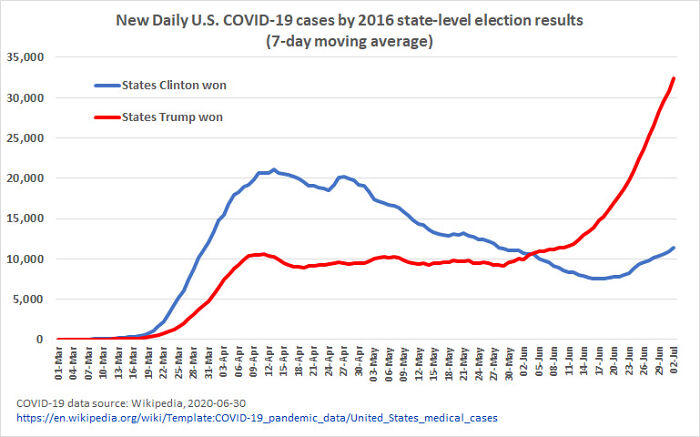
U.S. Covid-19 Cases By 2016 Election Results
There Was A Spike In Buying Of Kodak Stock In The Day Before The Announcement Of A Massive Loan From The Us Government Caused The Price To Skyrocket Over 1000%
Shower Temperature Compared To Handle Position
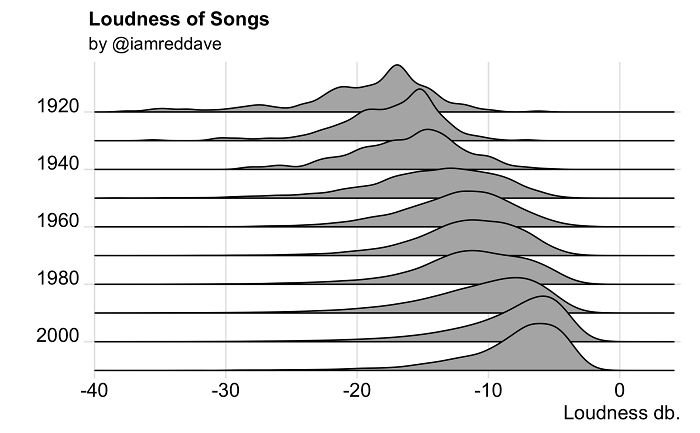
Songs Have Gotten Louder Over Time
This is what's known as the "loudness war". When mastering a recording, dynamic range compression is maximized to produce the loudest possible sound. It became rampant in the 90's. It usually results in LESS dynamic recordings.
For Everyone Asking Why I Didn't Include The Spanish Flu And Other Plagues In My Last Post
Conterminous Us Elevation Generalized By 500km² Hexagonal Tessellation
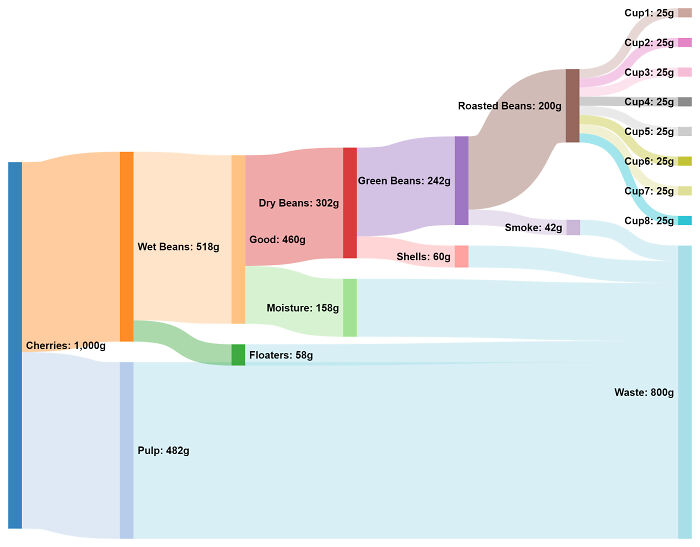
Crop To Cup. I Grew Coffee And Drank It, Made Some Notes
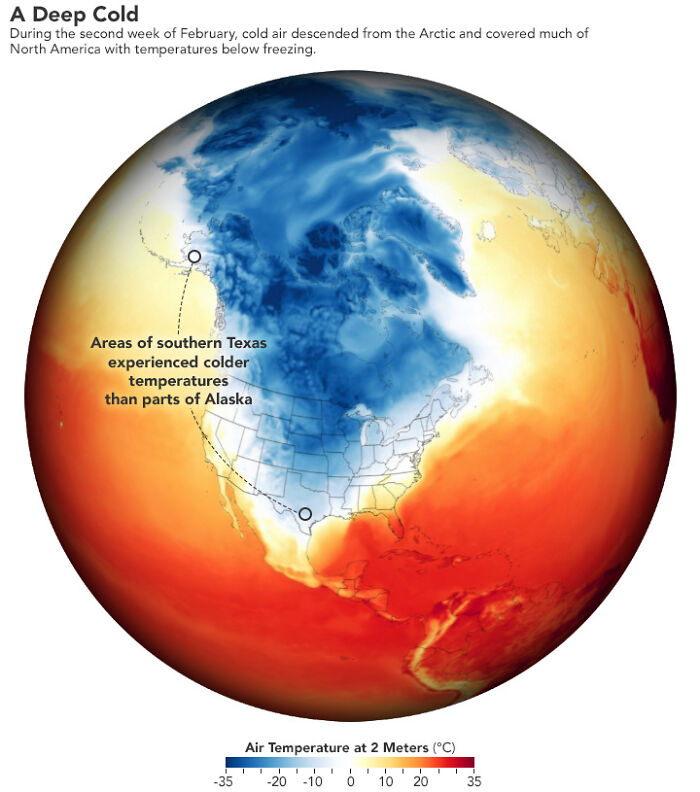
Southern Texas Got As Cold As Alaska. The Freezing Temps Prompted Dangerous Blackouts In Several Cities
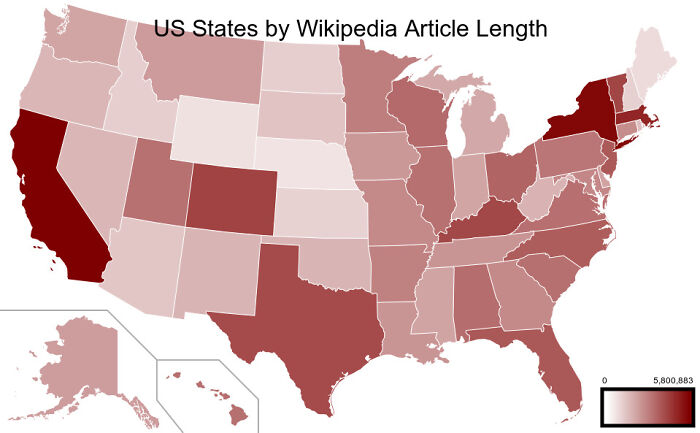
Us States By Wikipedia Article Length
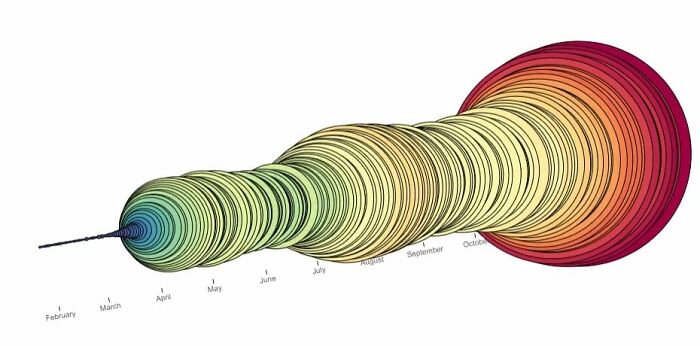
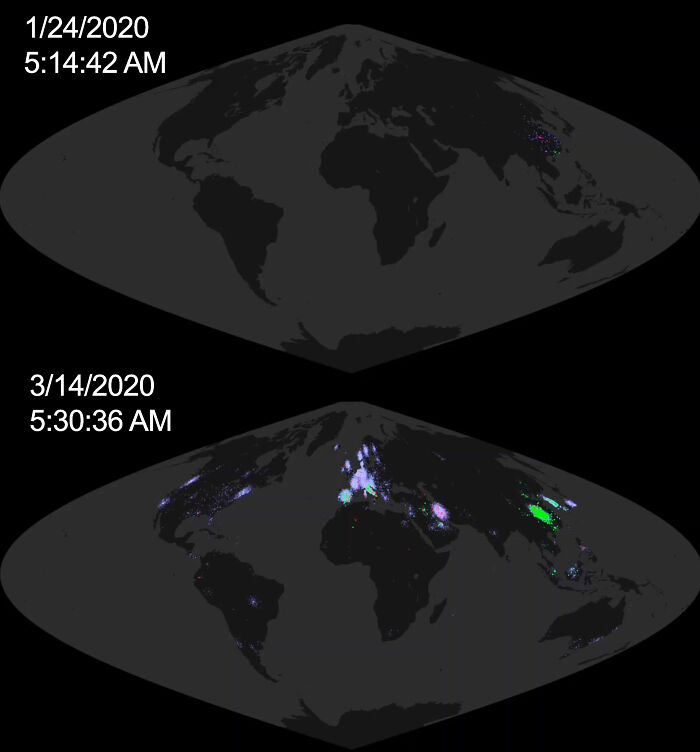
Covid-19 Spread From January 23 Through March 14th
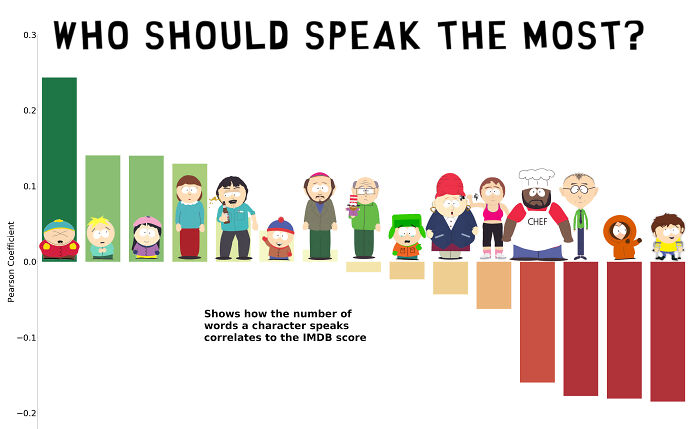
How The Number Of Words Spoken By A Character In An Episode Correlates With The Imdb Score Of South Park
Taylor Swift's Newfound Infatuation With Alcohol
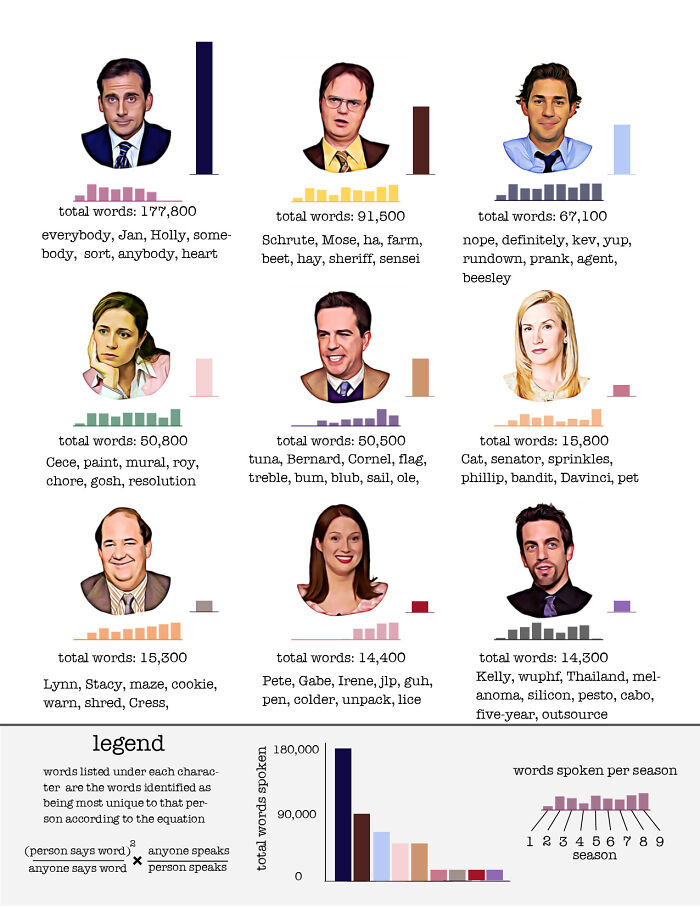
"The Office" Characters' Most Distinguishing Words
I wish they didn't take it off Netflix. I was just in the middle of rewatching it for the 3rd time
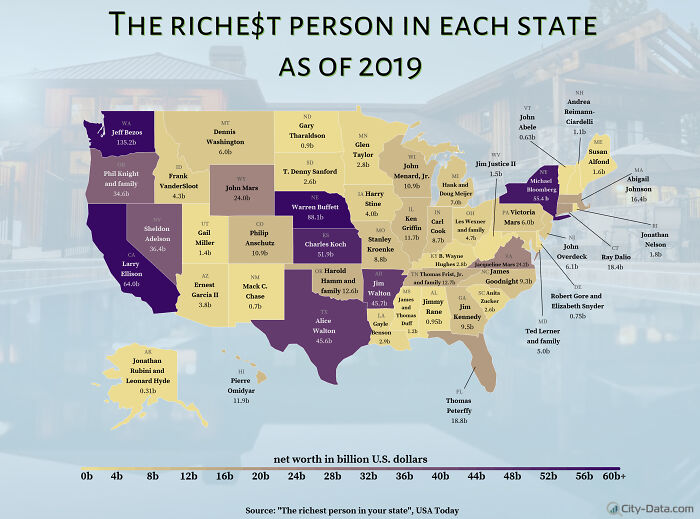
The Richest Person In Each State As Of 2019
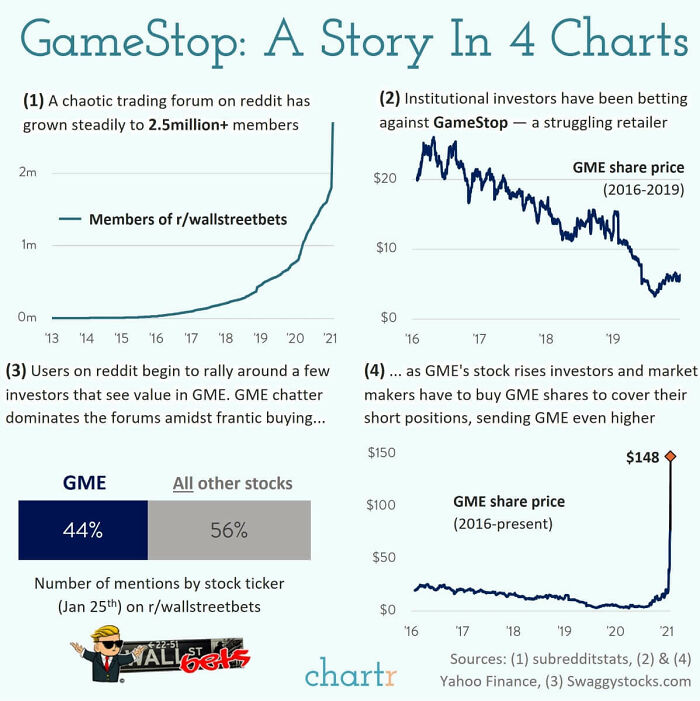
What's Going On With Gamestop In 4 Charts
Tinder Over 3 Years (18-21 Male)
Oreos I Have Not Stress-Eaten Yet
"Whitest" Injuries: Percentage Of Individuals Who Went To The Er For A Given Activity Who Reported As White
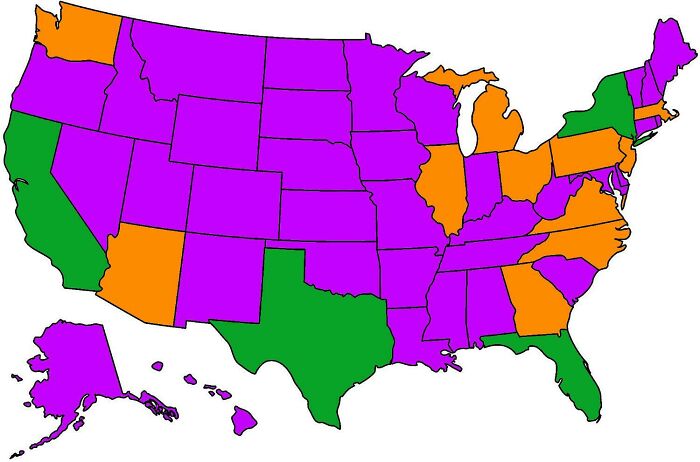
Each Color Represents 1/3 Of The Us Population
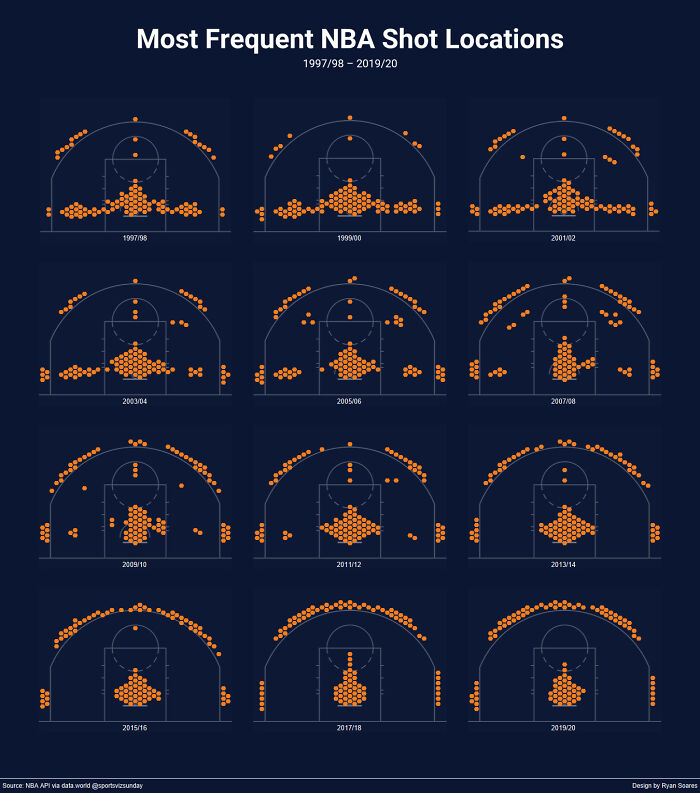
Most Frequent Nba Shot Locations
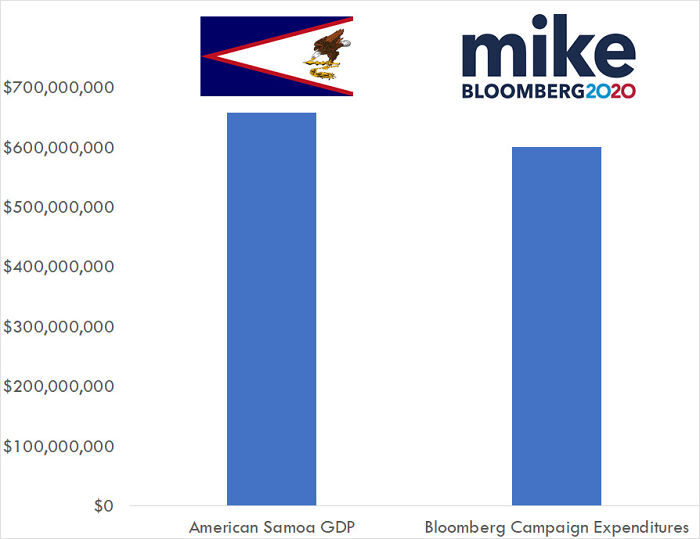
Bloomberg's Campaign Expenditures Compared To The Gdp Of The Only Primary He Won
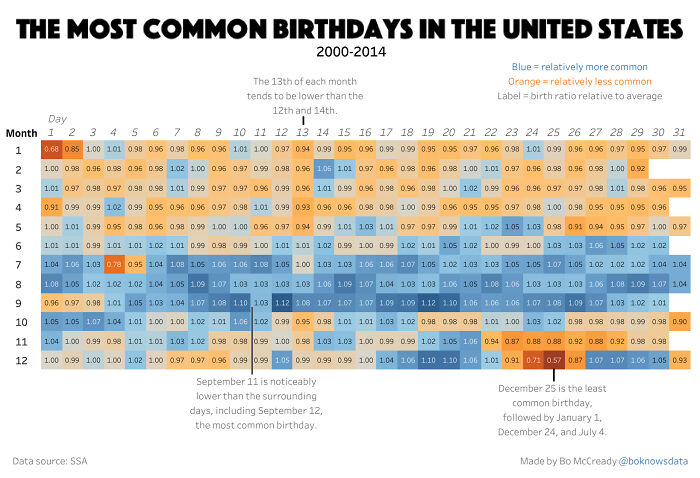
What Are The Most Common Birthdays In The United States?
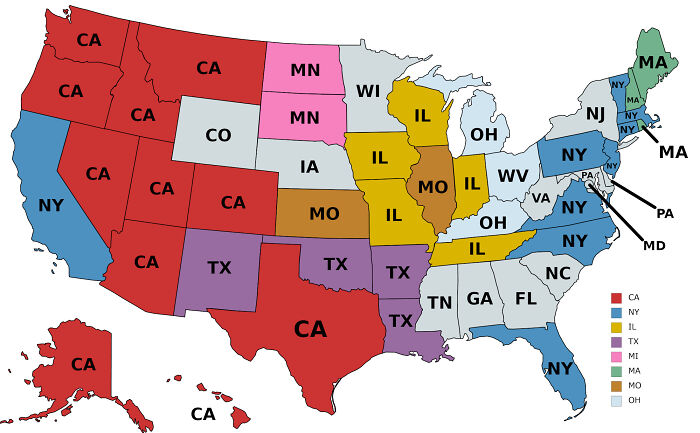
Source Of The Most Residents Born Out-Of-State, 2017
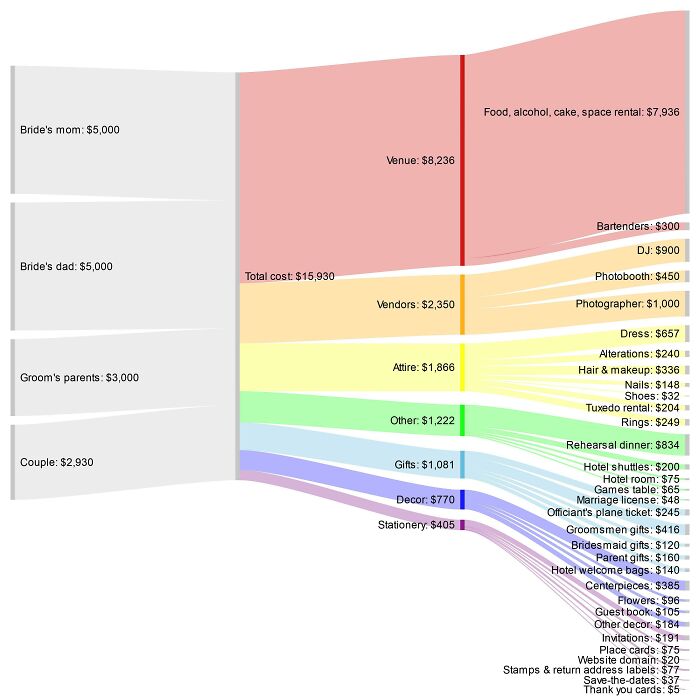
The Cost Of Our “Inexpensive” Wedding (Us, 2019)
I got married in 2017, and my wedding cost under $5,000, including the costs of flying out my parents. Don't believe the hype that you need to spend like this to enjoy the day.
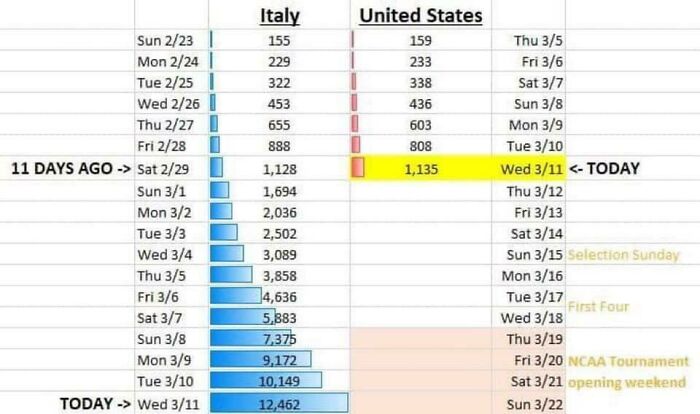
This Chart Comparing Infection Rates Between Italy And The Us
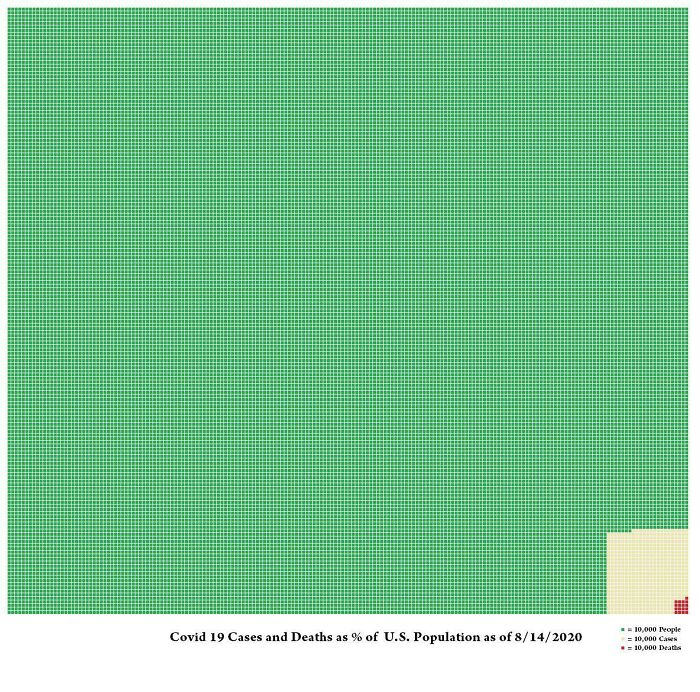
Covid Cases And Deaths In The U.S. As A Percentage Of Total Population. 1 Square = 10,000 People
So what you're saying is that's 170,000 deaths. 170,000 families devastated in mourning, 170,000 best friends now struggling with grief. Tens of thousands of parents who've lost their children, or children who've lost their parents or grandparents, or spouses/significant others who've lost the loves of their lives. Actually, when you consider how many people just one individual is important to, HUNDREDS OF THOUSANDS of people who are now mourning. Hurting. And it could be prevented, we could STOP it and SAVE people if we look at it THAT way and take it SERIOUSLY and have empathy. Please.
I like this a lot, but what I condemn is that sources are not directly given with the pictures, or, with easily shared pictures, even embedded into them. It is just to easy to forge such figures that are not based on facts that those based on facts shold make good examples!
There is a link to the source under almost every picture (Pro tip: It's all from https://www.reddit.com/r/dataisbeautiful) - or did you mean the original source?
Load More Replies...Because like 1/3 of bored panda are reddit aggregates. (Not really complaint; I would never have seen this otherwise)
Load More Replies...No. 12 is wrong, at least for germany. The chancellor is the equivalent to prime minister not the queen. You should list the federal presidents instead. The current one is Frank-Walter Steinmeier.
Some of them are really cool,other are a bit biased or misleading

 Dark Mode

 No fees, cancel anytime













![Leonardo Dicaprio Refuses To Date A Woman His Age [oc] Leonardo Dicaprio Refuses To Date A Woman His Age [oc]](https://static.boredpanda.com/blog/wp-content/uploads/2021/03/6059ee78b78a9_erdv3yn78d941-png__700.jpg)
