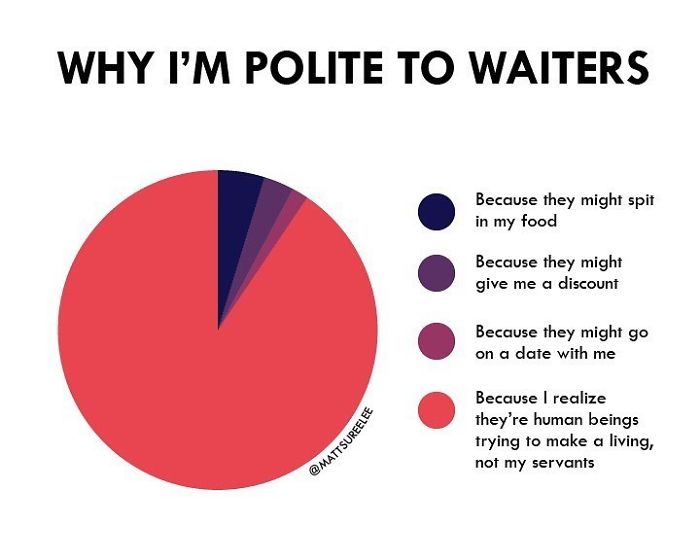
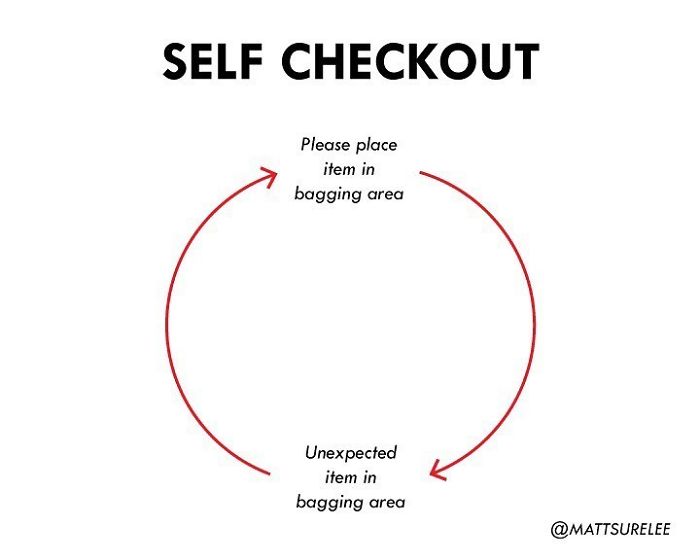
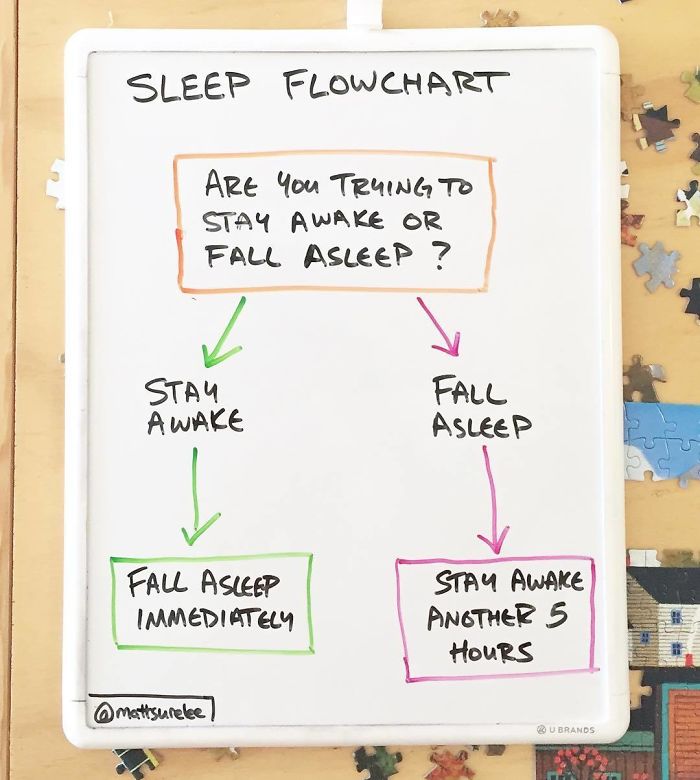
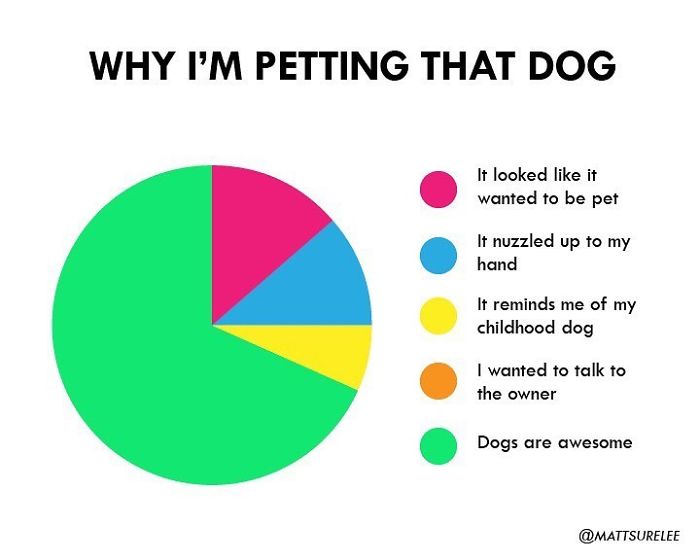
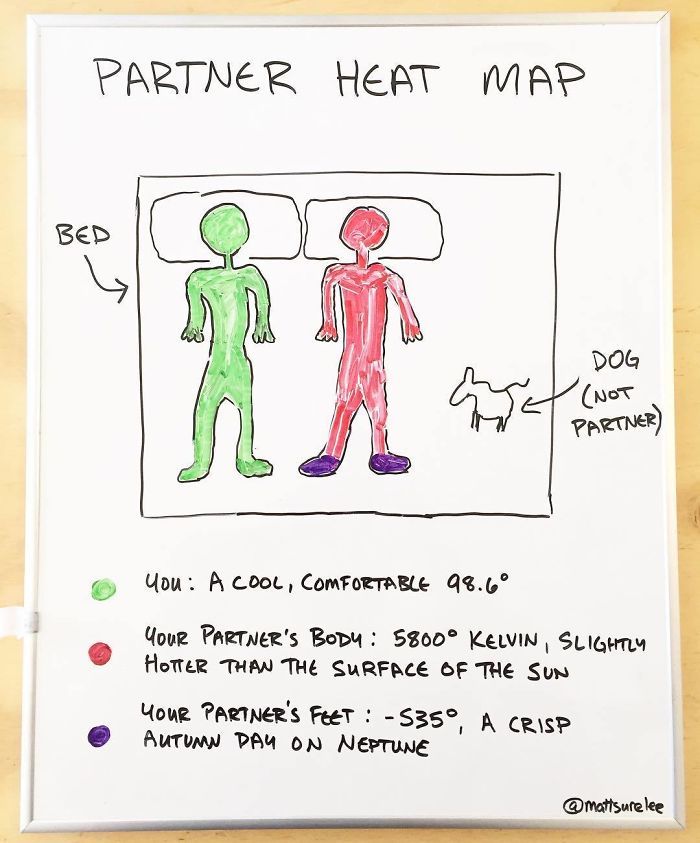
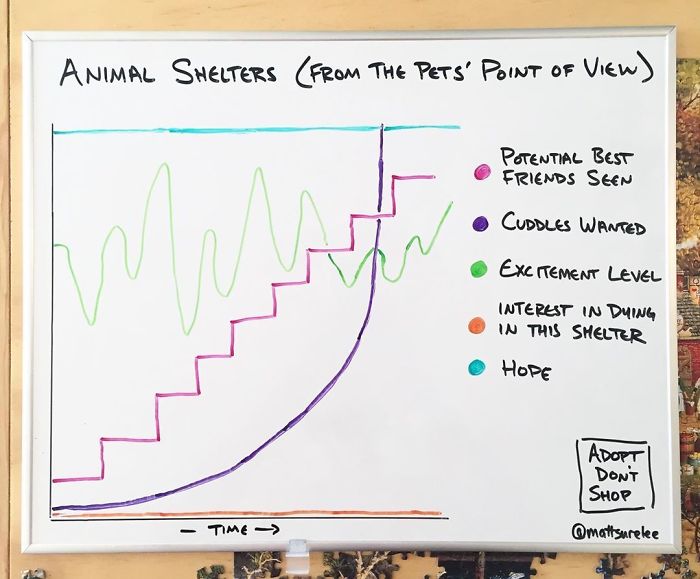
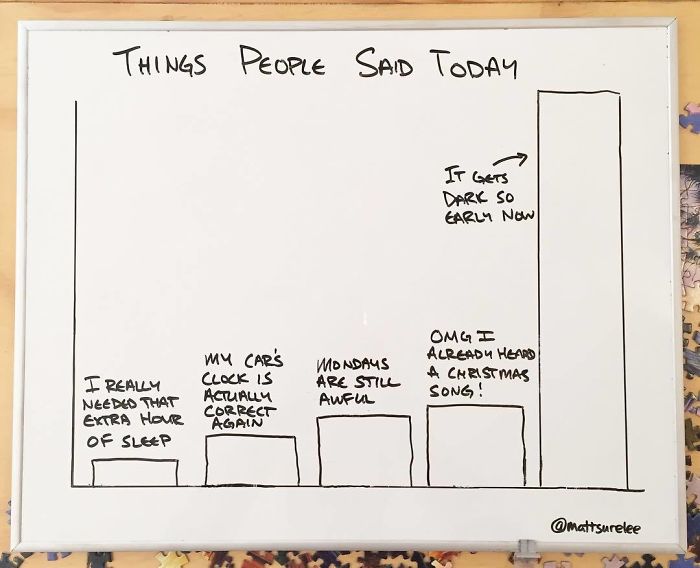
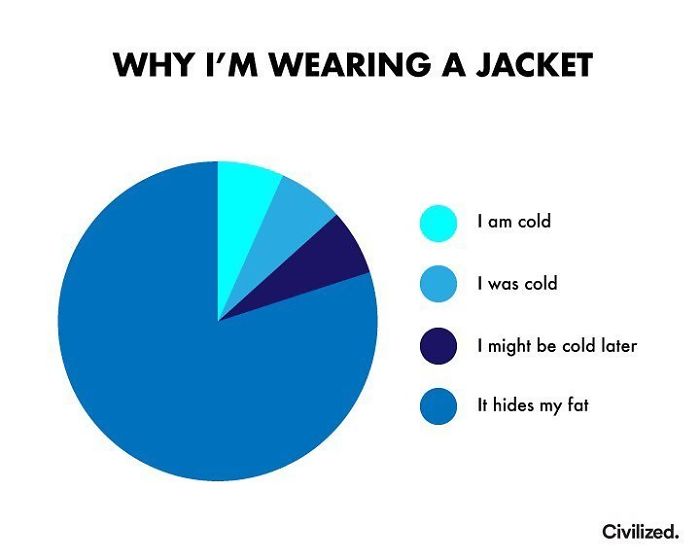
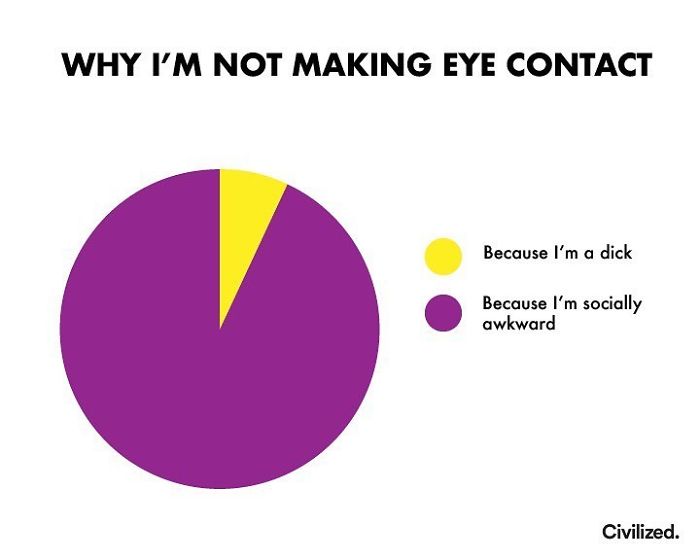
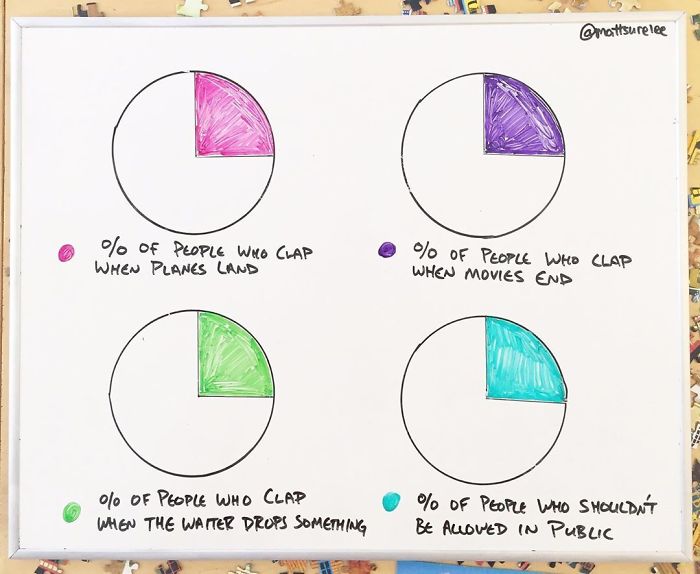
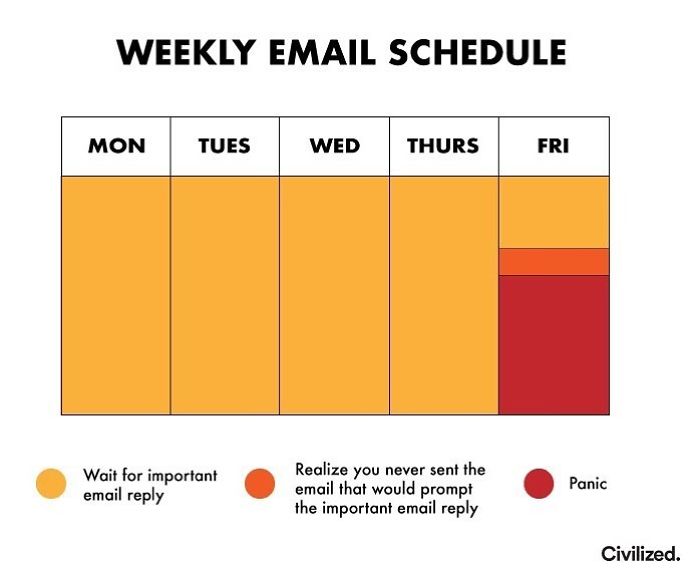
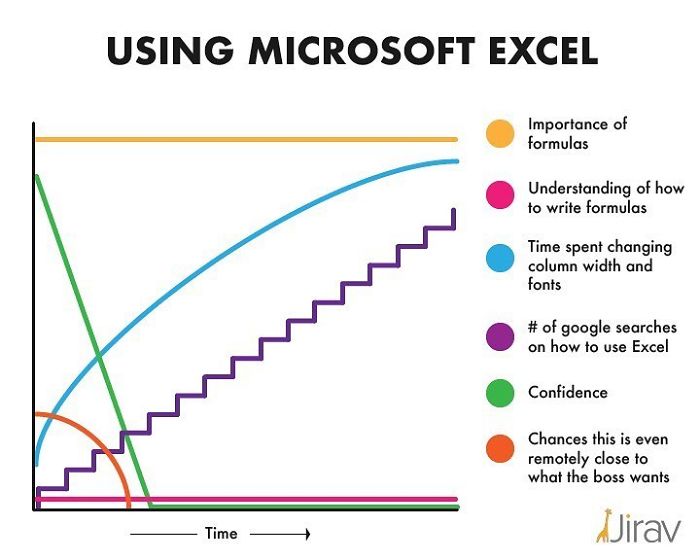
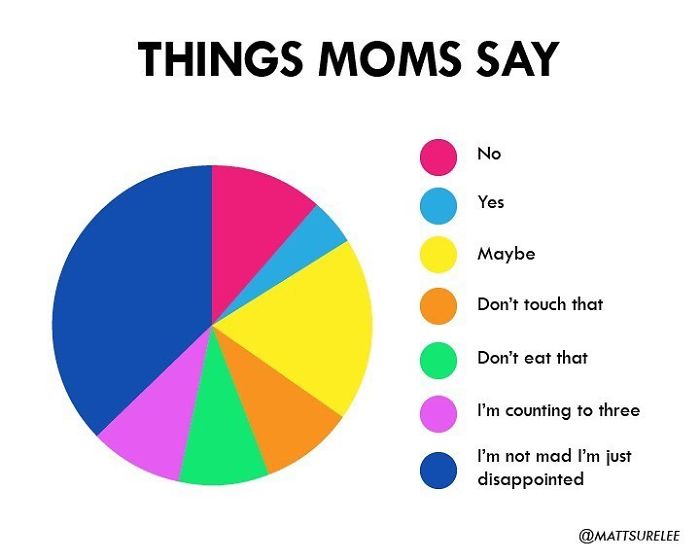
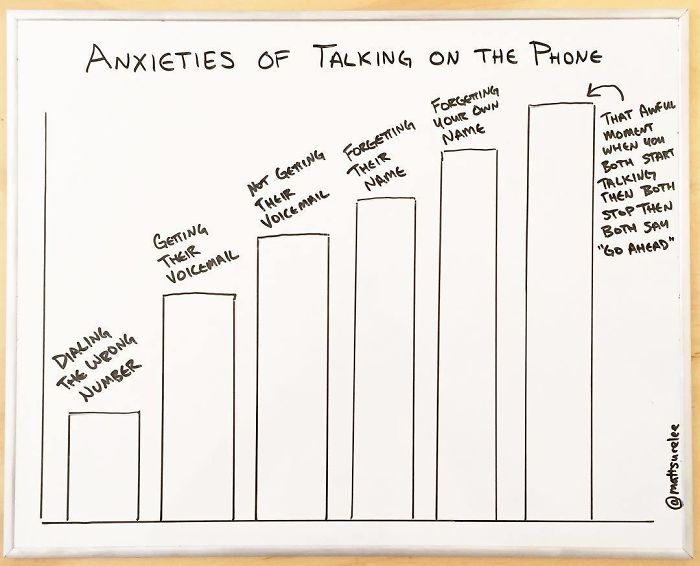
Charts. Graphs. Doodles. Whenever you put a bored Panda in front of a whiteboard, they’re very likely to let their creative talents loose. But how many of us have thought of turning drawing on whiteboards into a profession? Meet Matt Shirley. He draws hilarious charts and has a huge following online.
Shirley does them all masterfully and he’s a professional at using them to show the humorous side of life. What’s more, he has an outstanding work ethic: he tries to draw a graph every single day. That’s the sort of dedication you’d usually see only in top-tier athletes and best-selling authors.
Bored Panda talked to Shirley about his charts, what keeps him motivated to draw daily doodles, as well as what graphs have that other mediums don’t. Scroll down for our in-depth interview, upvote your favorite charts, and share the ones you like with your friends.
After you’re done with this article, have a look through our previous post featuring Shirley’s charts.
More info: Instagram | MattShirleyCharts.com | Facebook | Twitter | Patreon
This post may include affiliate links.
“I've always loved anything visual or design-related, so it's a natural fit for me to try to do something visual or design-related on my Instagram,” Shirley told Bored Panda in an interview.
“Sometimes, it is a challenge to keep motivated, but the good thing about charts is that you can pretty much do one on any topic,” he said.
“I'm not confined to a certain field of expertise which helps with inspiration. If I'm not feeling inspired to create something on a certain topic I can always look in the complete opposite direction for something that activates the creative juices,” Shirley explained his creative process and how he avoids burnout.
I don't get why they just don't put a logo on one side to help this. All computer female USB connector are put on the same orientation.
Shirley revealed the reason why he’s so into charts: “I like charts because they don't require a lot of reading and there's an inherent discovery process whenever you are trying to figure out what a chart is trying to depict, whether it's for entertainment or data-driven.”
“The only limitations I've found are with the types of jokes you can include. If you want long-winded setups and character-driven jokes then charts are definitely going to be difficult to work with,” he said, drawing attention to the fact that the best jokes to be made with charts are quick, concise, and snappy.
Bored Panda was interested to find out what Shirley thought was his best work so far. According to him, he’s very proud of his chart where he depicts how rick-rolling works: “I think I was most proud when I thought of this cycle.”
Shirley’s creativity and humor have given him a massive following online: more than 300,000 people follow his Instagram account. Dear Readers, what do you think of Shirley’s charts? Which ones do you like best? What charts and graphs would you love for him to draw in the near future? We’re looking forward to hearing your thoughts in the comments below!
Apple Watch have me credit for standing all day just for getting drunk and passing out in a rocking chair.
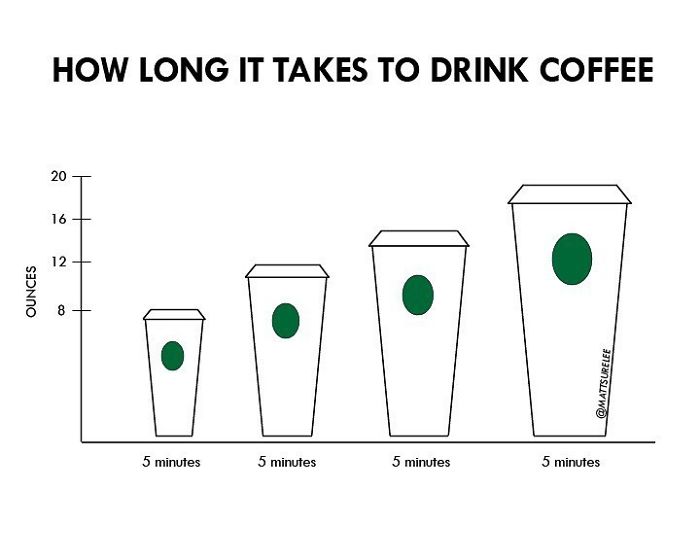
I had to look up how much these ounces are and now I'm wondering who the hell would be drinking more than half a litre of coffee in that giant cup on the right?

 Dark Mode

 No fees, cancel anytime


