Someone Put ‘Your Chances Of Dying’ In An Infographic, And You May Want To Reconsider Your Life Choices
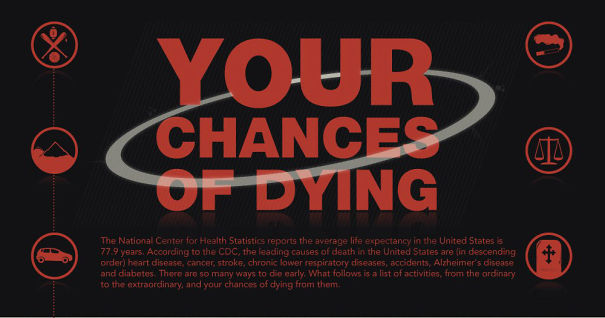
We are all going to die one day, and most of us try our best to put it at the back of our minds and try not to think about it too much. Some people can’t help themselves, however, and worry about the danger of all kinds of high-risk activities.
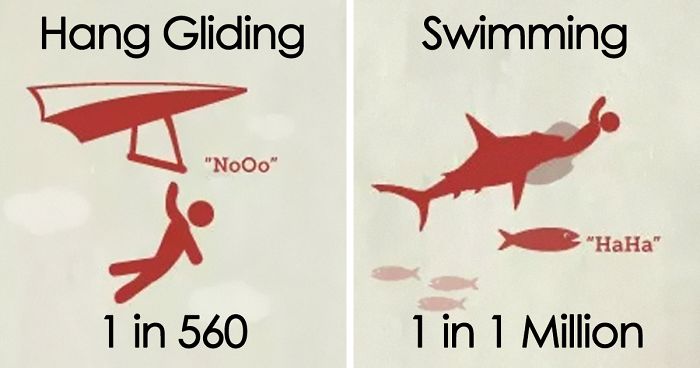
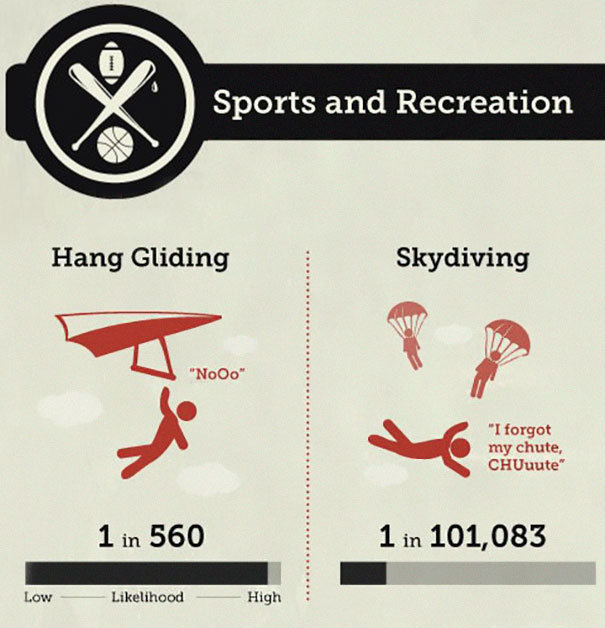
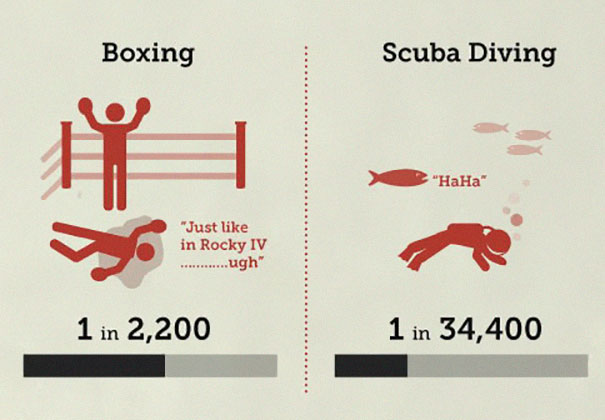
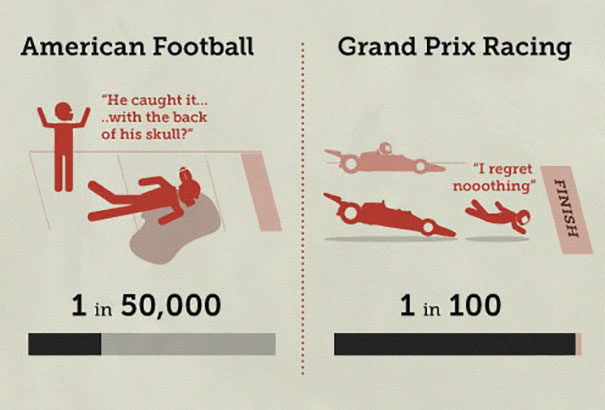
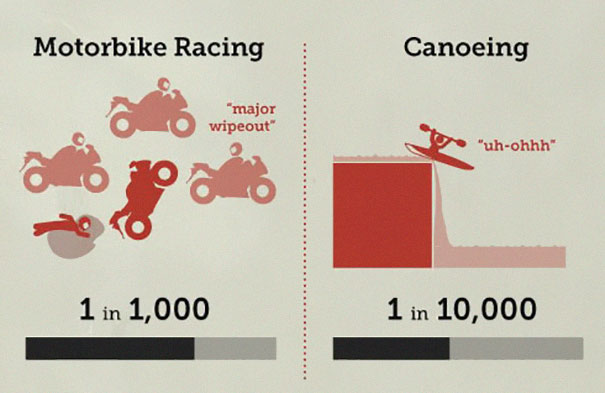
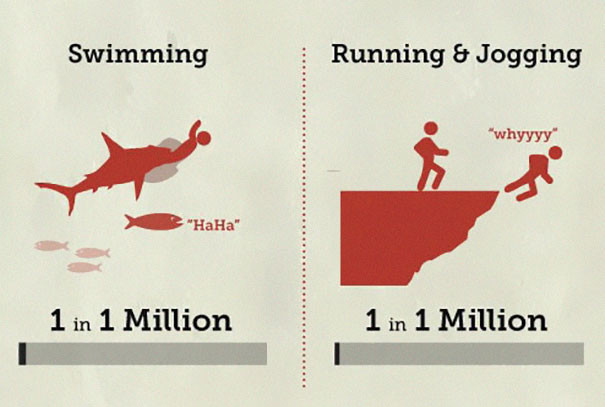
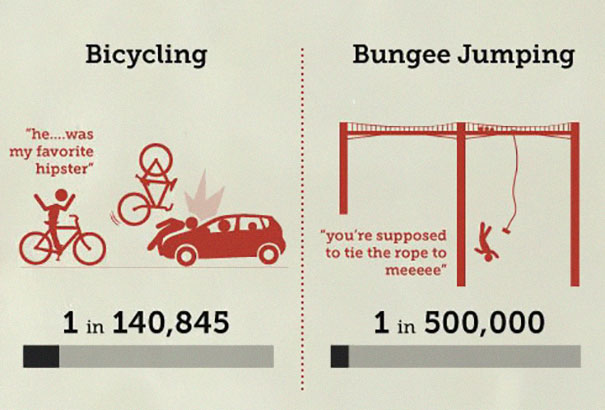
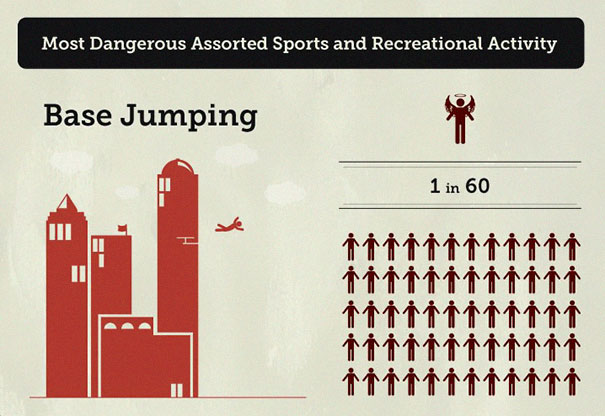
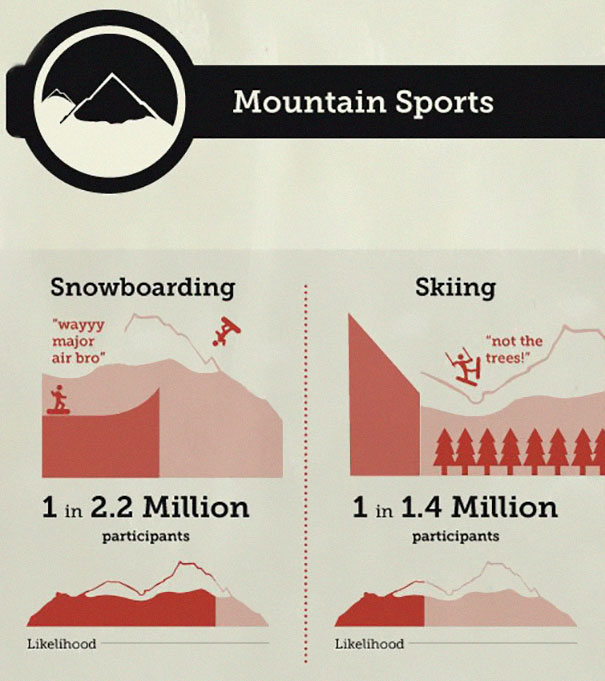
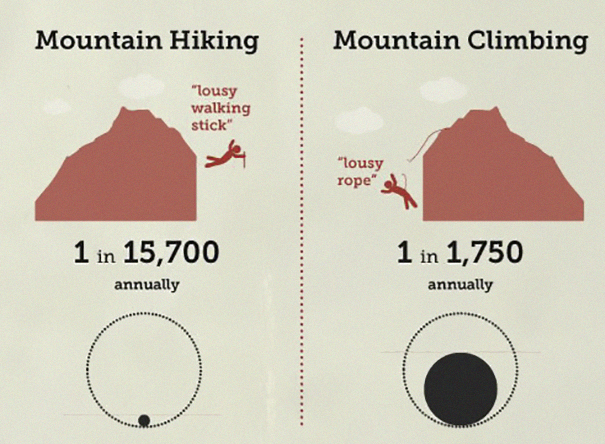
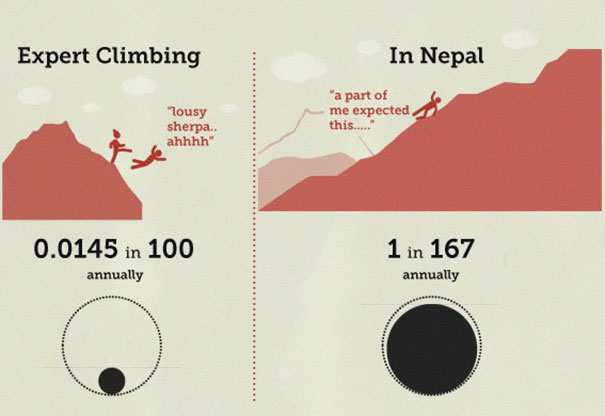
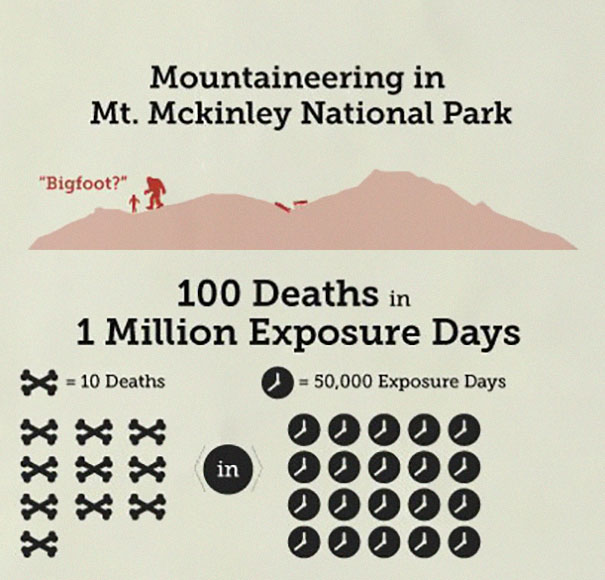
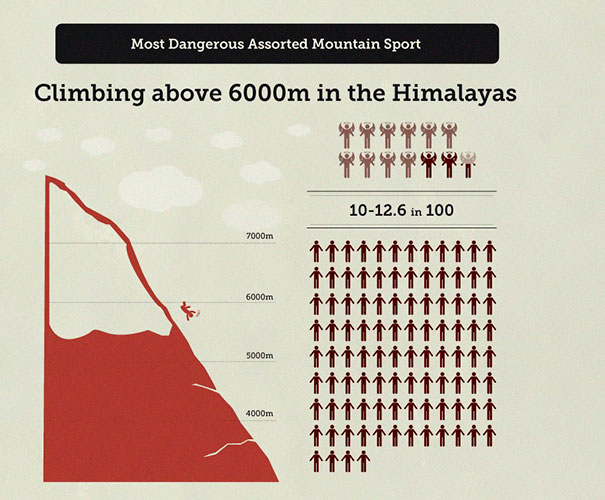
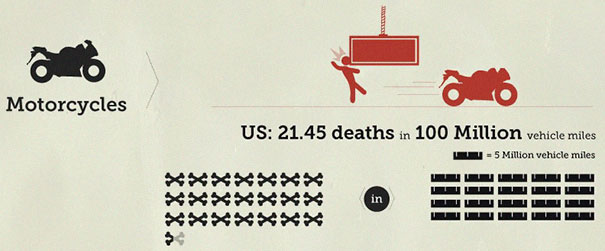
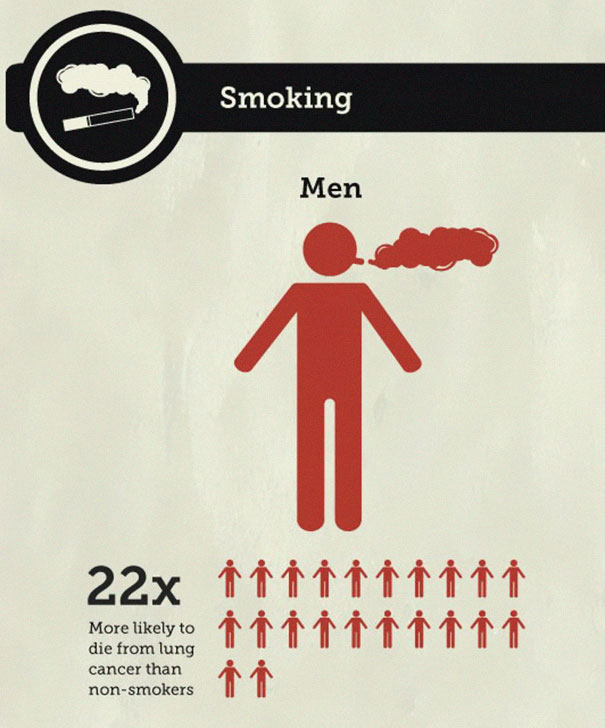
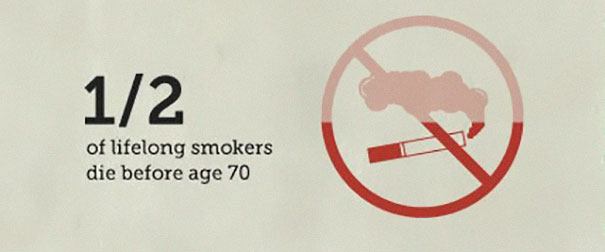
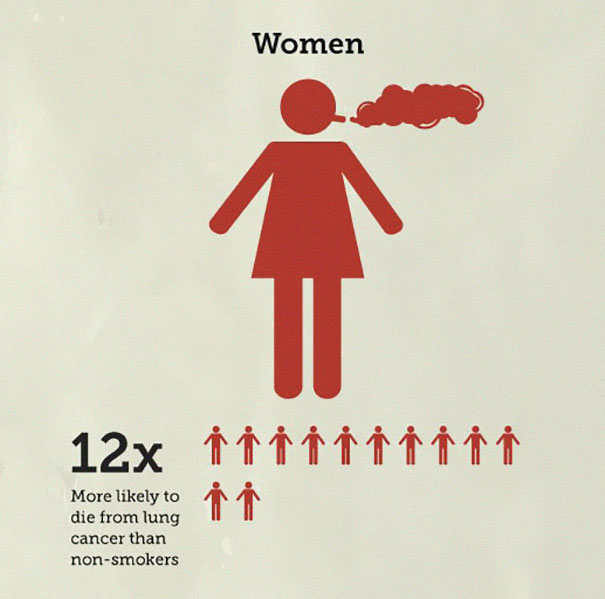
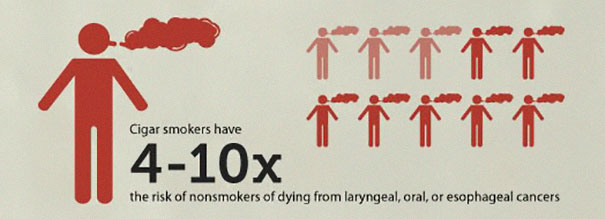
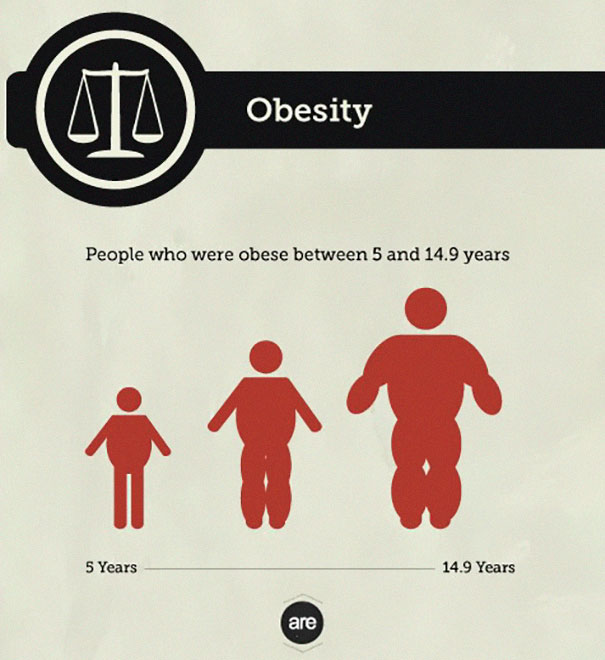
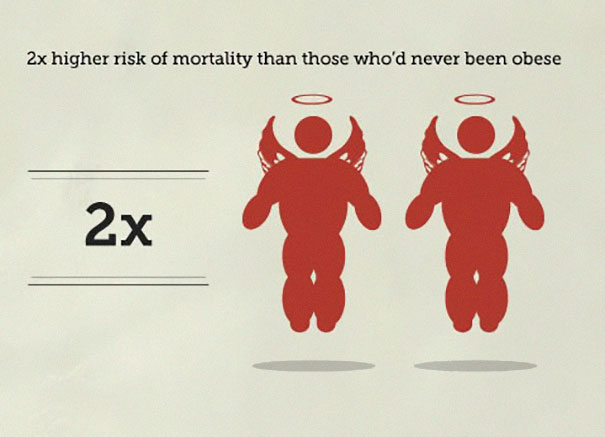
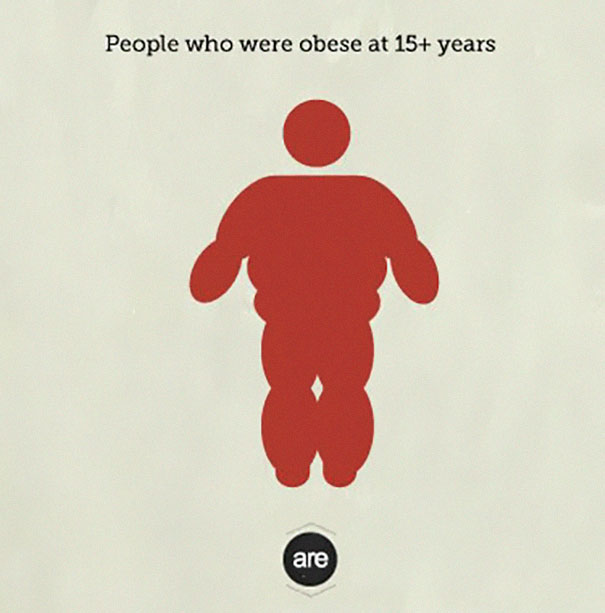
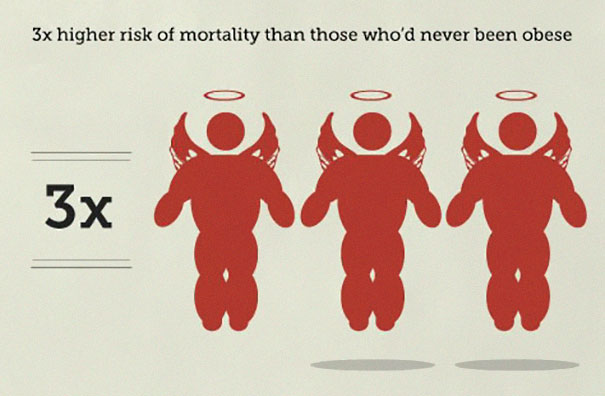
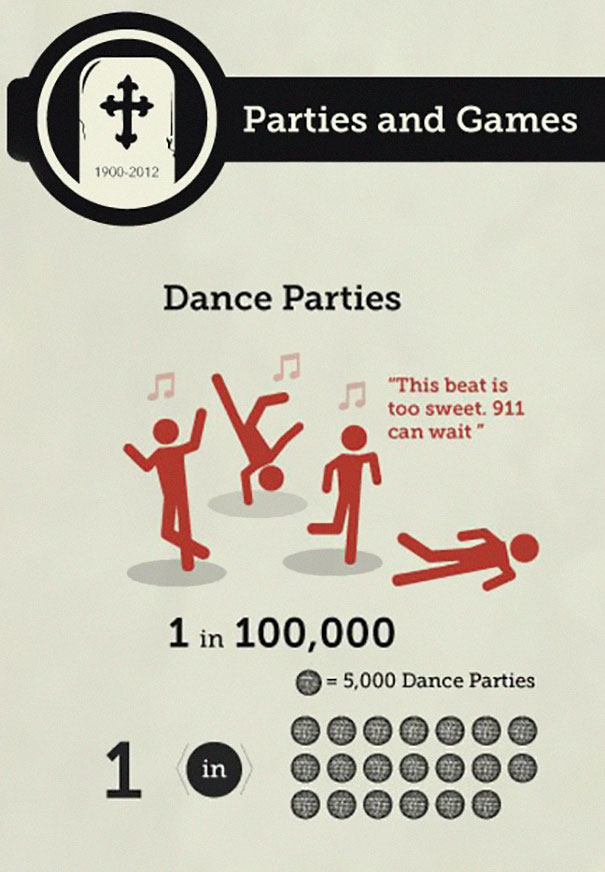
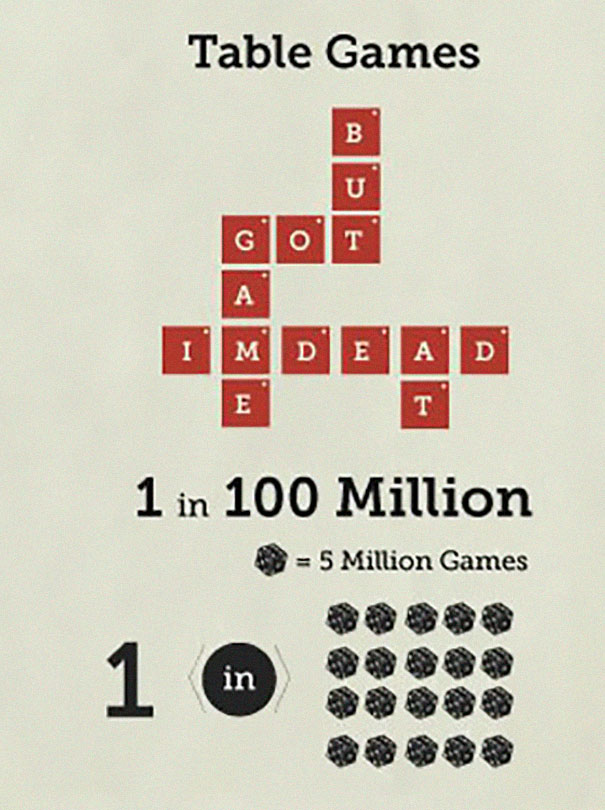
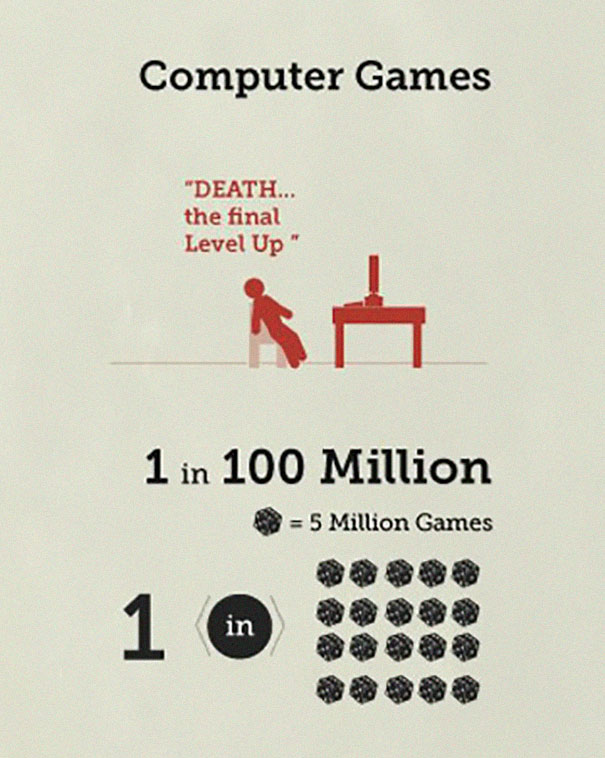
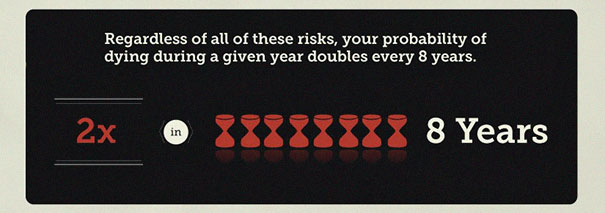
Someone has helpfully compiled an infographic of for these people, listing the estimated chances of death in various scenarios and types of sports, from motorbike racing to obesity. Some of these sports statistics offer a genuinely surprising perspective, for example, skydiving and bungee-jumping are much safer than you would think, particularly when compared to something seemingly more innocent, like canoeing, where sports injuries and deaths are a-plenty.
The interesting facts were presented by Best Health Degrees, which collated the statistics from the US National Centre for Health Statistics’ database. Of course, the results are always changing, with new technologies contributing mostly to a safer world, but the overall results certainly put the risks that we choose to take into context. Scroll down below to check the fun facts out for yourself, and let us know what you think in the comments!
Someone has helpfully compiled an infographic listing the estimated chances of death in various scenarios, from motorbike racing to obesity
I have a problem with the way the statistics are shown. Some are shown as a ratio (1 in 100k) and others are shown as annual deaths, and then there was another in the mountain climbing group that seemed to go off on a statistical tangent and I have no clue what exactly it was measuring.
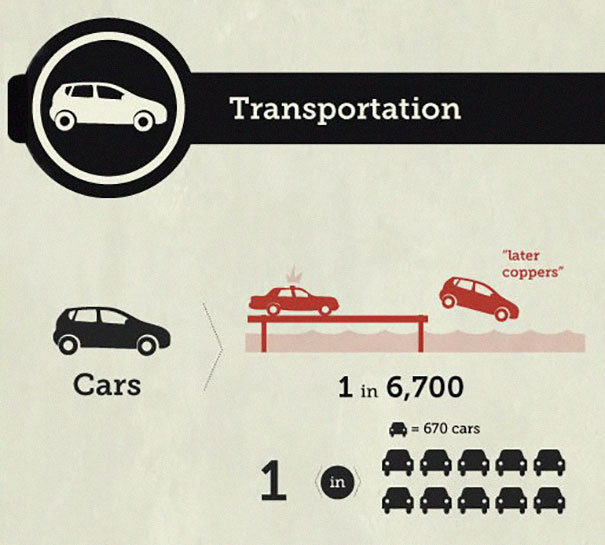
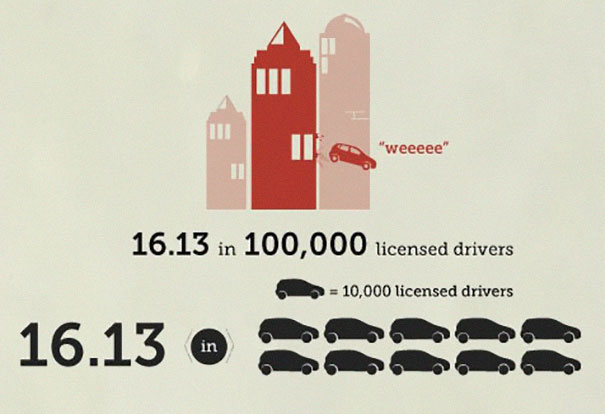
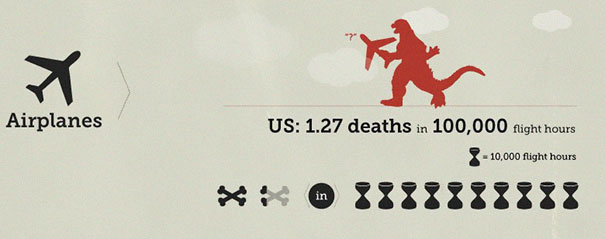
Agree! It started off really interesting and made sense, but it's like they ran out of energy and started using random comparisons from "expert climbing" onwards. I mean, 1 in 6,700 cars vs 16.13 in 100,000 licensed drivers? (why not say 1 in 6,200?) And then 1.27 deaths per 100,000 flight hours?! (why not 1 in 78,740?) Shame! Please do a second version; there's so much potential!
Load More Replies...I'm calling BS on Grand Prix racing being more dangerous than motorbike racing. Racing cars have evolved a lot since the death of Ayrton Senna in 1994, while on a bike you just go flying and... that's pretty much it.
Both sports are actually now relatively safe, modern race cars are safer and modern motorcycle race gear is insanely protective, with new innovations rolling out every year. The numbers shown here don't state where the data was derived from, or how many years of statistics were used to come up with those numbers. If they started counting back in the early days of racing, the attrition rate was crazy high, if they only count the past 10 years, the death count is much lower.
Load More Replies...I have a problem with the way the statistics are shown. Some are shown as a ratio (1 in 100k) and others are shown as annual deaths, and then there was another in the mountain climbing group that seemed to go off on a statistical tangent and I have no clue what exactly it was measuring.
Agree! It started off really interesting and made sense, but it's like they ran out of energy and started using random comparisons from "expert climbing" onwards. I mean, 1 in 6,700 cars vs 16.13 in 100,000 licensed drivers? (why not say 1 in 6,200?) And then 1.27 deaths per 100,000 flight hours?! (why not 1 in 78,740?) Shame! Please do a second version; there's so much potential!
Load More Replies...I'm calling BS on Grand Prix racing being more dangerous than motorbike racing. Racing cars have evolved a lot since the death of Ayrton Senna in 1994, while on a bike you just go flying and... that's pretty much it.
Both sports are actually now relatively safe, modern race cars are safer and modern motorcycle race gear is insanely protective, with new innovations rolling out every year. The numbers shown here don't state where the data was derived from, or how many years of statistics were used to come up with those numbers. If they started counting back in the early days of racing, the attrition rate was crazy high, if they only count the past 10 years, the death count is much lower.
Load More Replies...
 Dark Mode

 No fees, cancel anytime







317
68