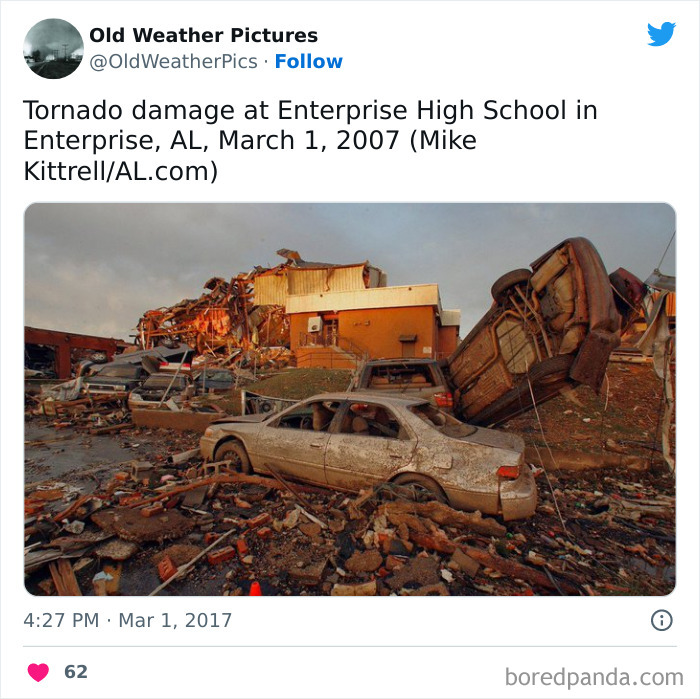
30 Extreme And Crazy Weather Examples From The Past, As Shared On This Twitter Page
'Old Weather Pics' is a Twitter account that, as the name suggests, takes you back in time with vintage photographs of weather phenomena.
From stunning lightning strikes to powerful snowstorms, tornadoes, and hurricanes, the account has plenty of reasons to remind everyone why we appreciate the power of nature.
It was created in 2014 and seems to have stopped posting in 2021. Still, during those seven years, it shared plenty of interesting and rarely seen images, so we decided to commemorate the work that went into this interesting little online project by presenting to you, dear Pandas, their uploads that we enjoyed the most.
More info: Twitter
This post may include affiliate links.
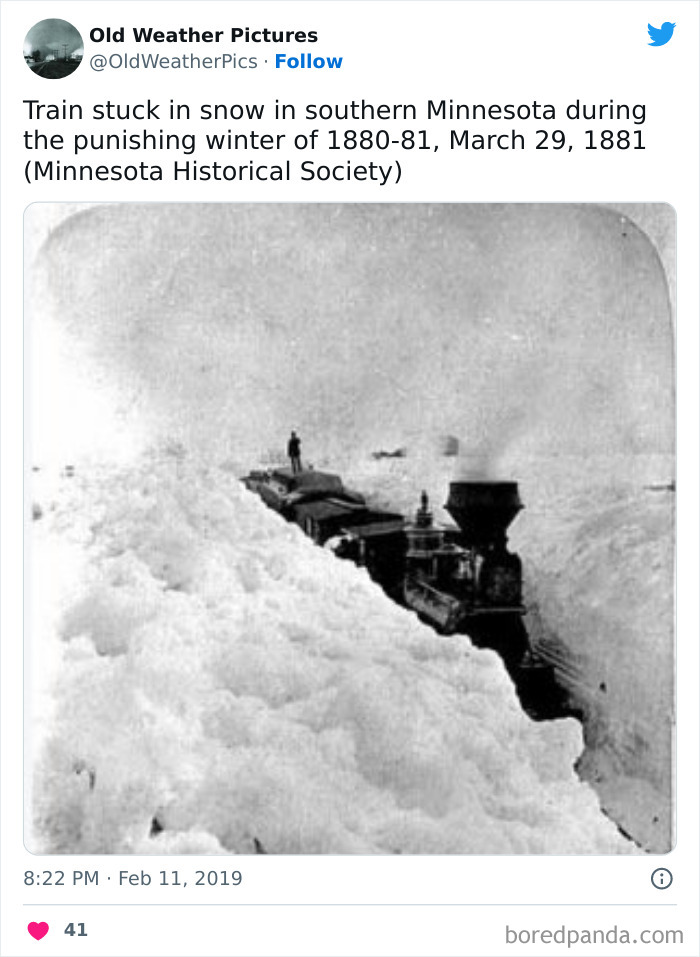
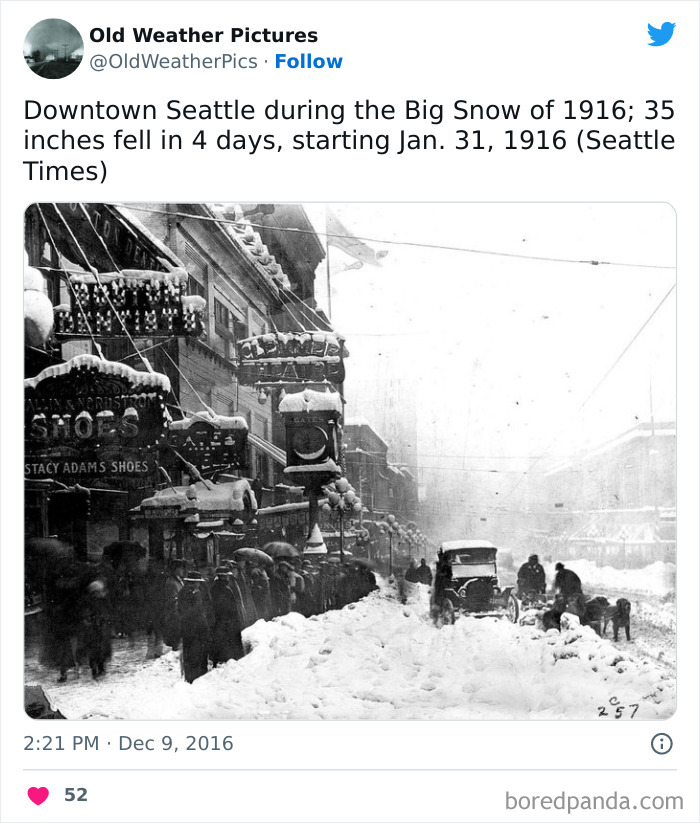
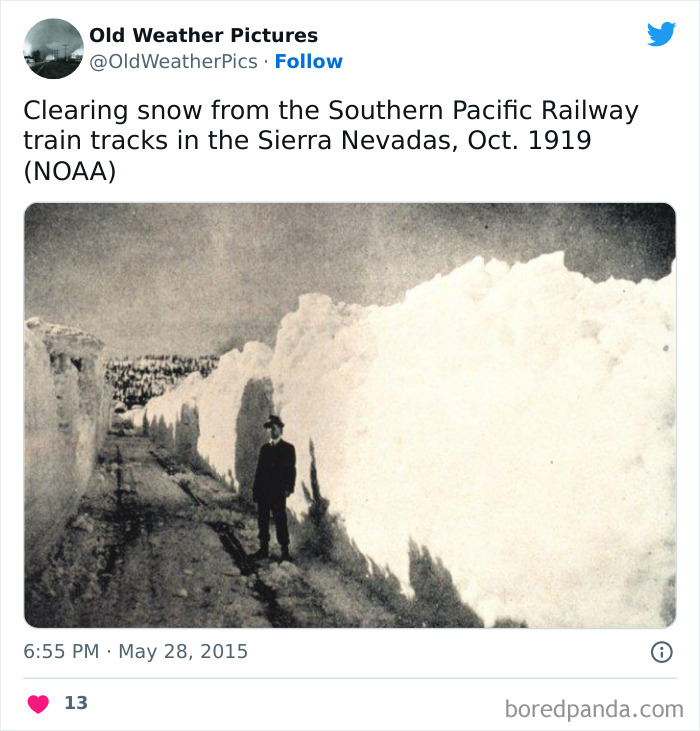
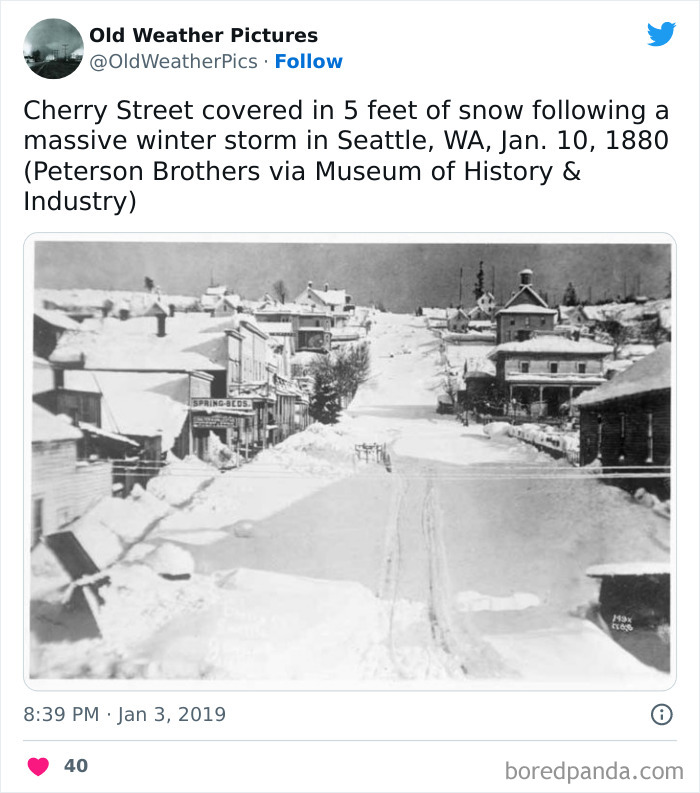
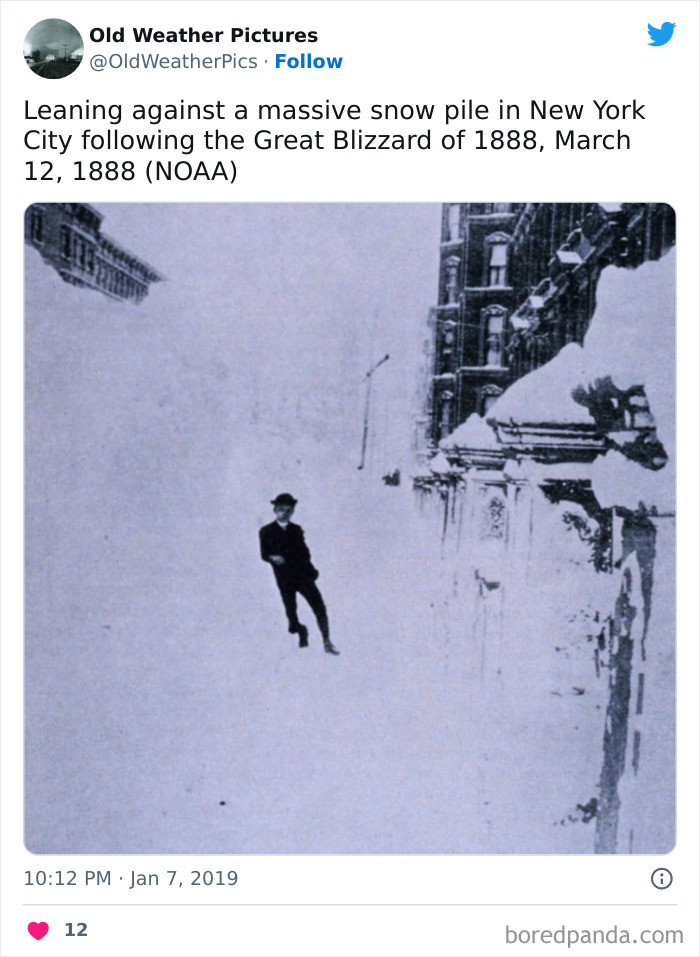
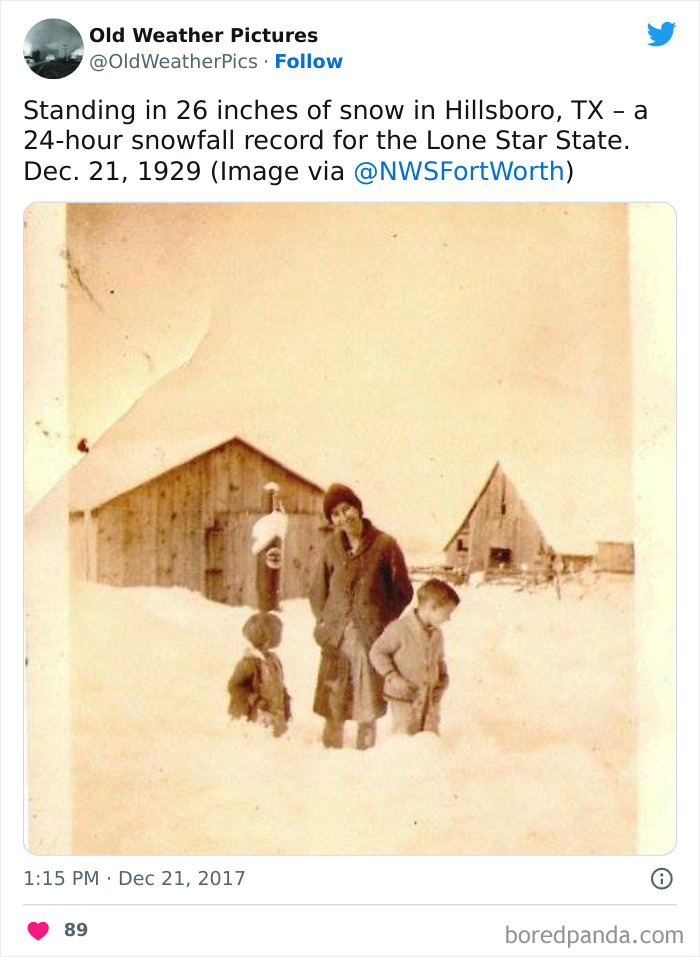
Hey, I think they talked about this horrendous winter in one of the Little House on the Prairie books!
Scientific studies indicate that many of the extreme weather events you see in these pictures are likely to become more frequent or more intense with human-induced climate change.
Long-term changes in climate can directly or indirectly affect many aspects of society in potentially disruptive ways. For instance, warmer average temperatures could increase air conditioning costs and affect the spread of diseases, and while increased precipitation can replenish water supplies and support agriculture, intense storms can damage property, cause loss of life and population displacement, and temporarily disrupt essential services such as transportation, telecommunications, and energy.
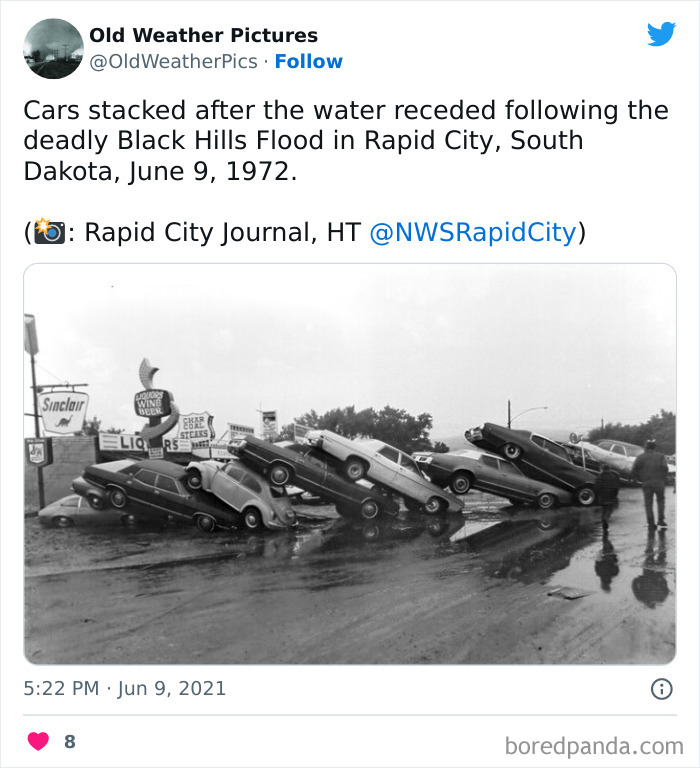
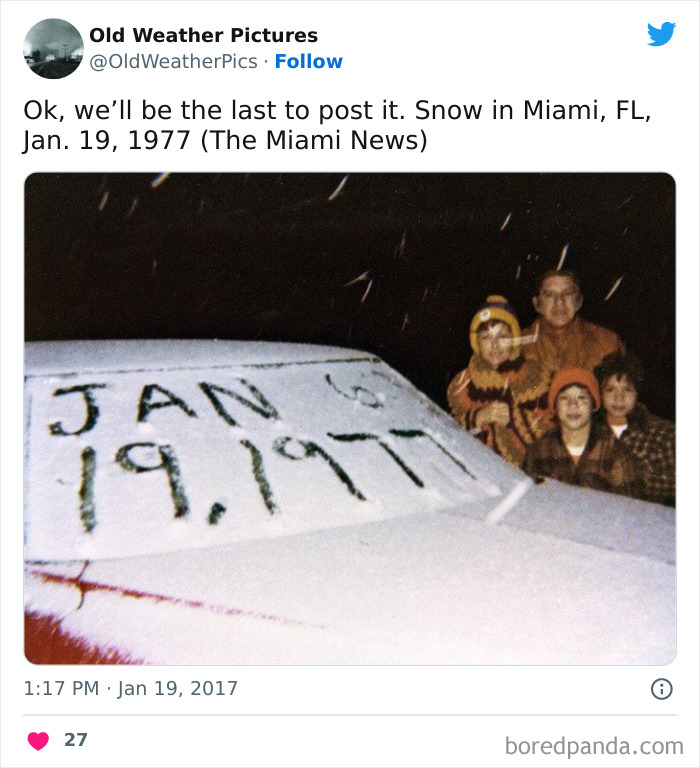
Slug Bug! (actually 2) ... For those who don't know, it was a game where someone hit/slugged the person next to them if they saw a VW beetle, while calling out, "slug bug". ... It couldn't be played before the 1990's because there were still too many -- and it isn't played now because there are too few. ... I miss seeing the little round cars.
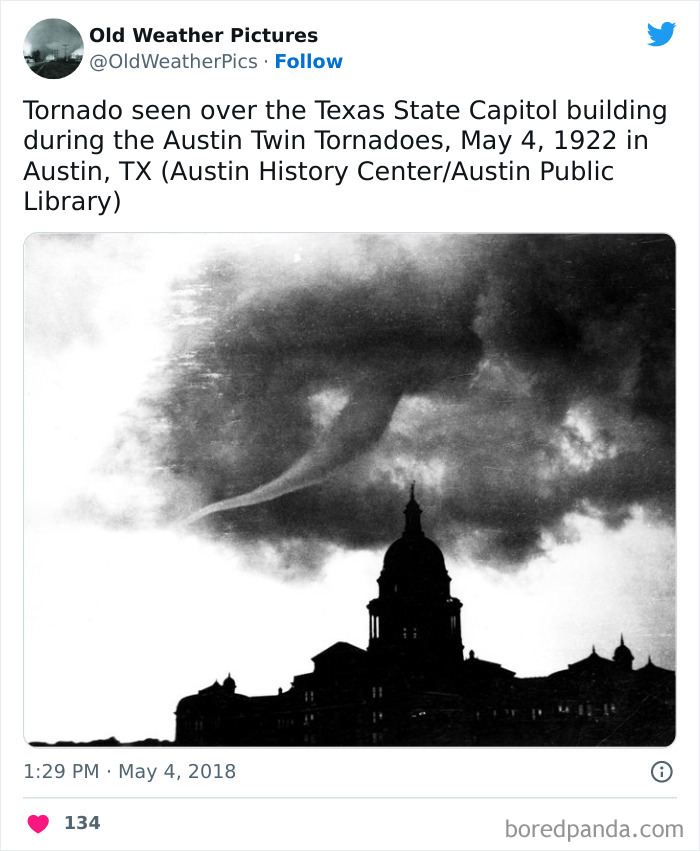
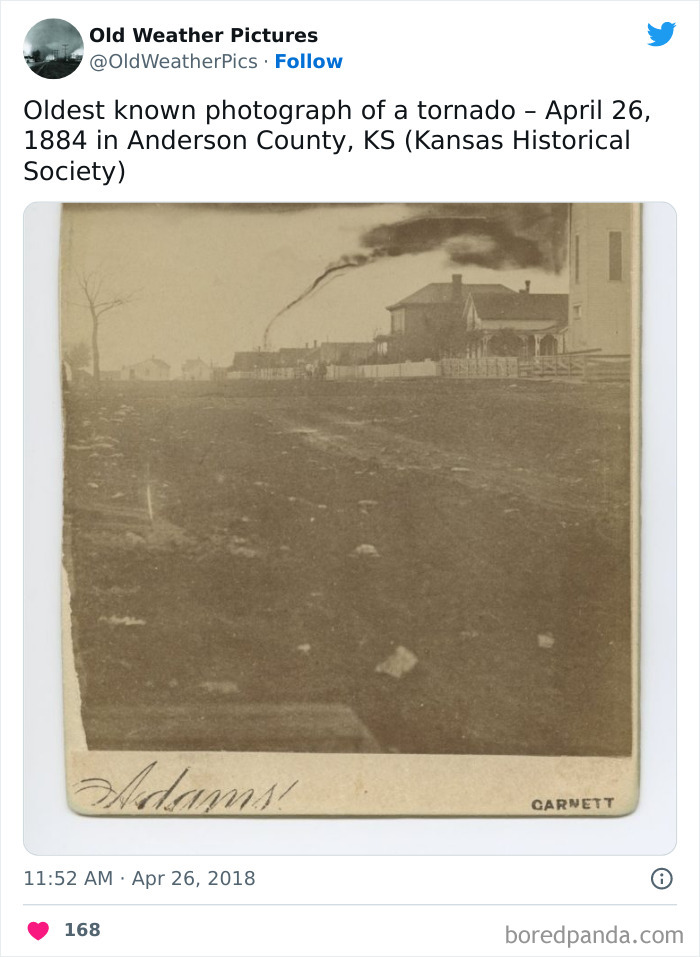
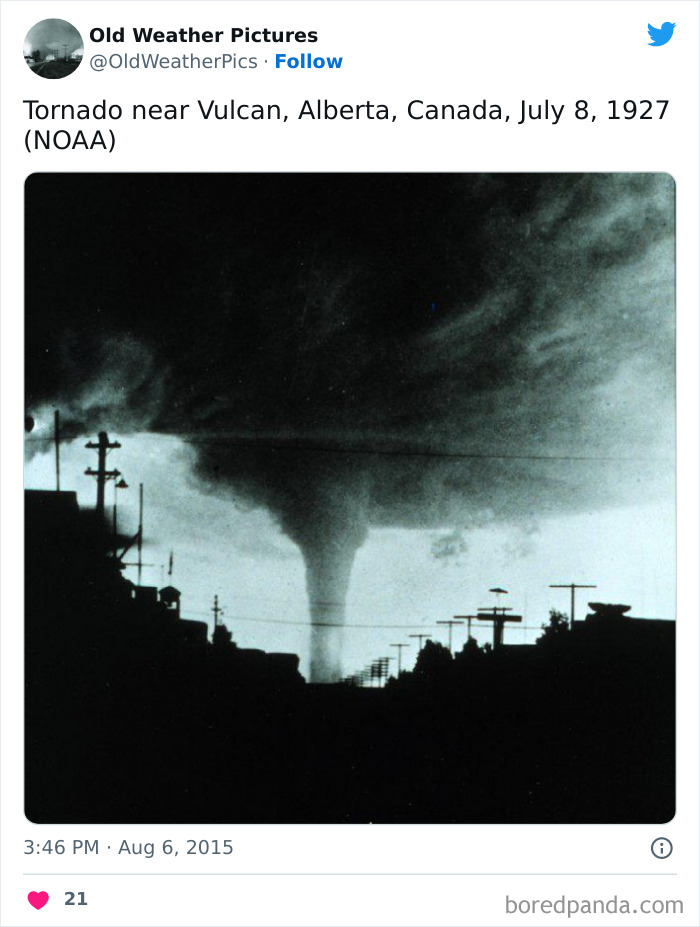
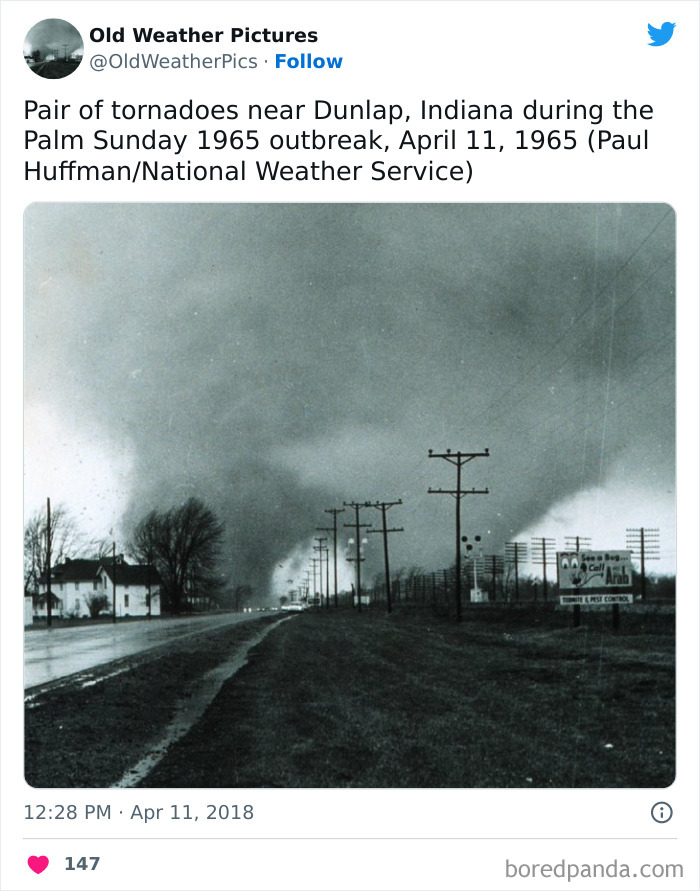
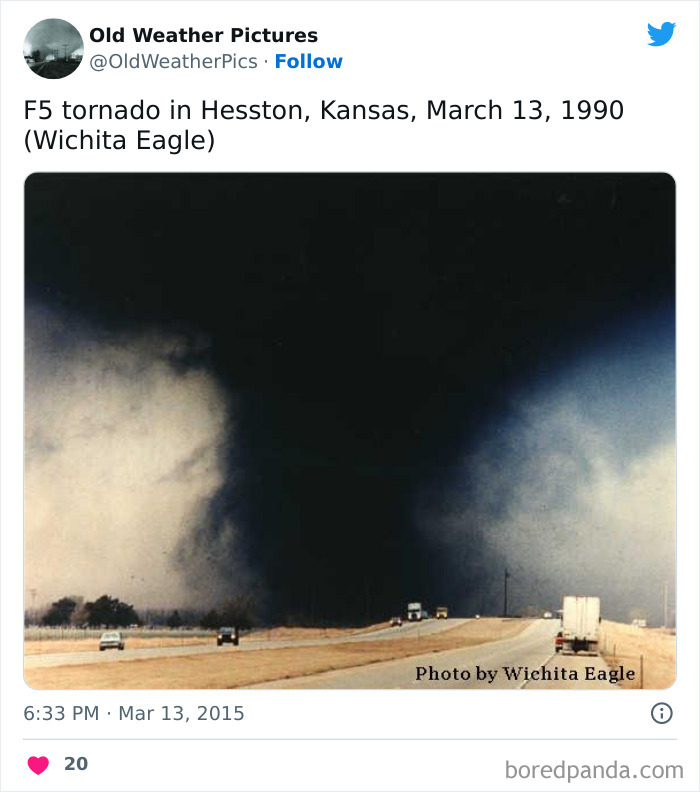
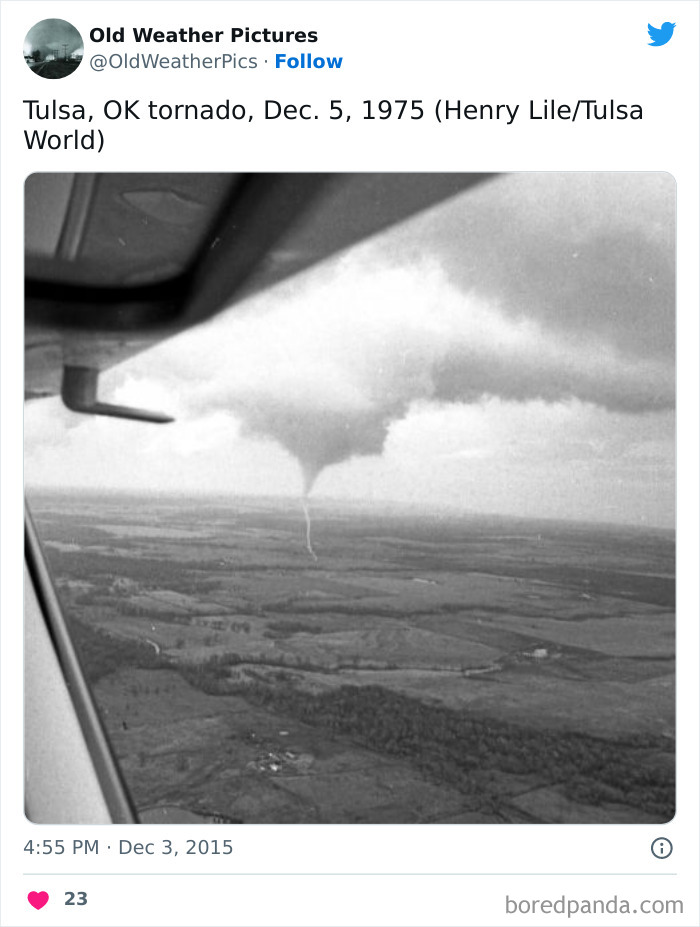
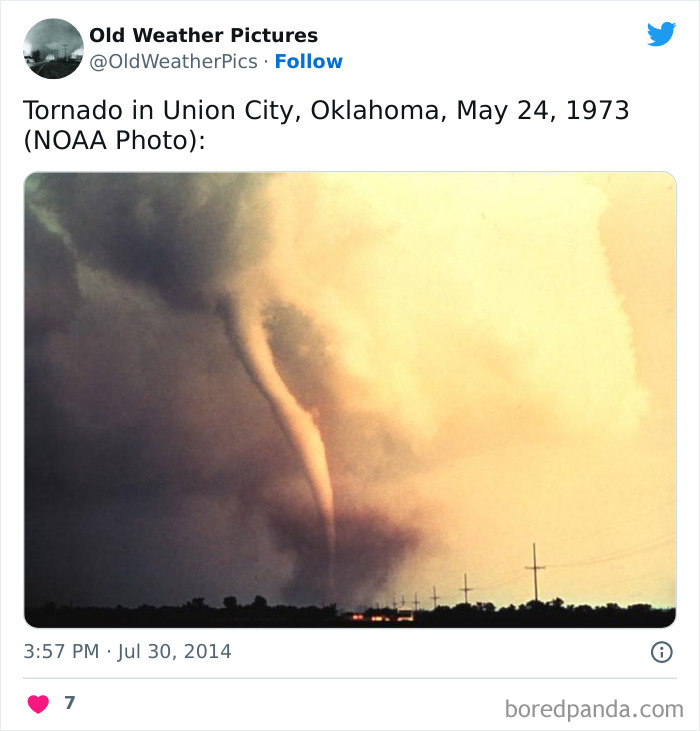
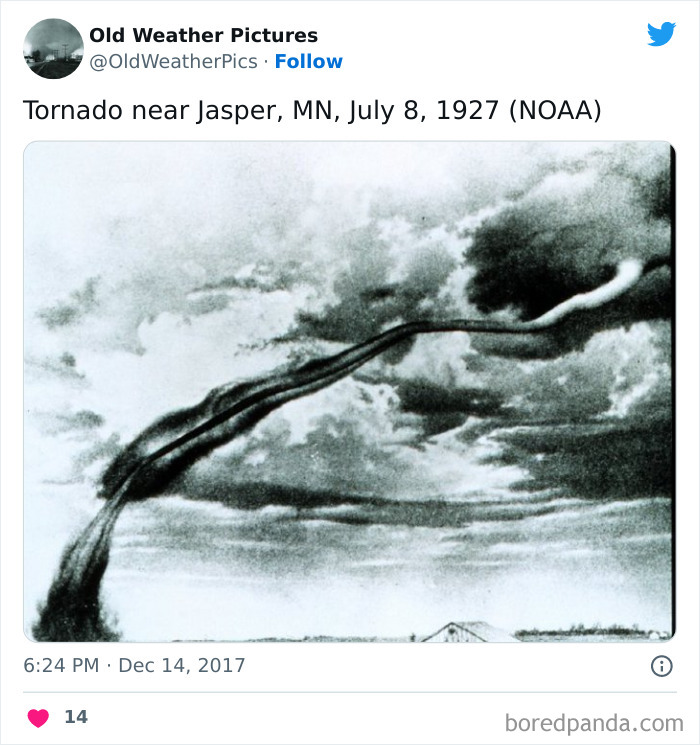
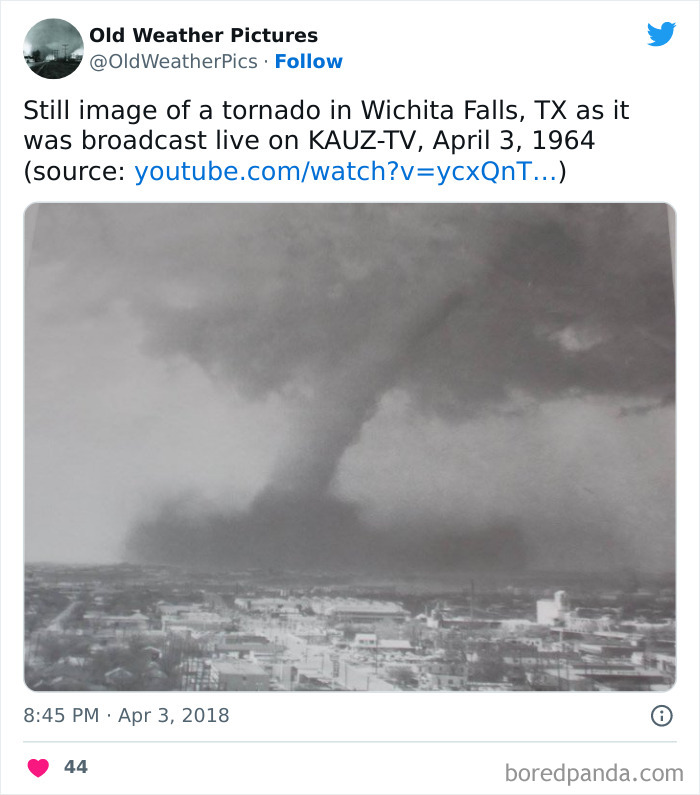
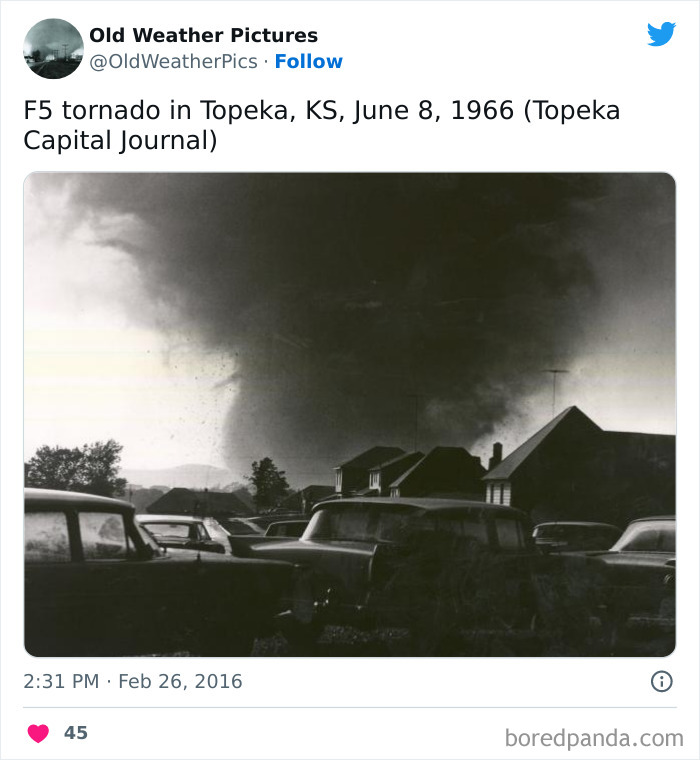
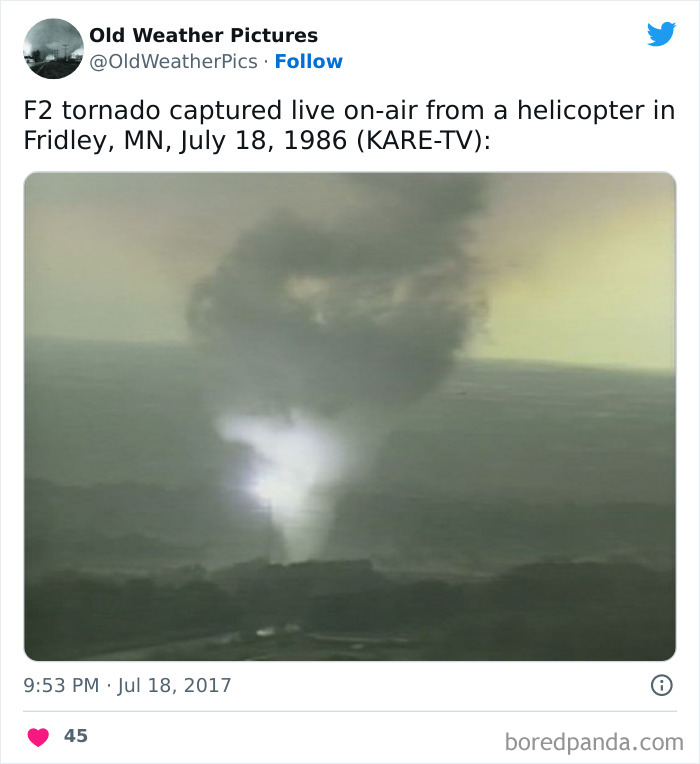
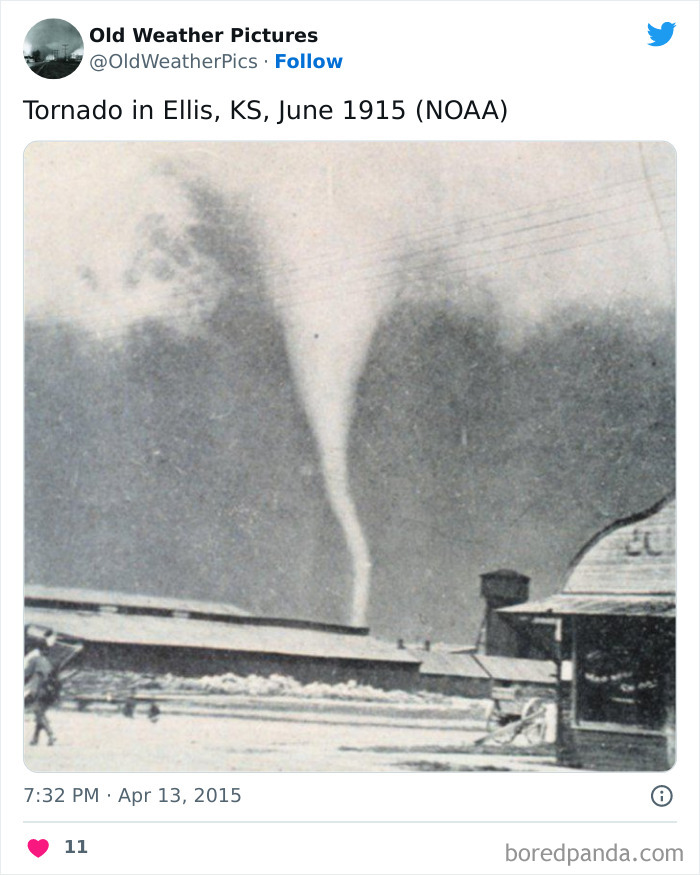
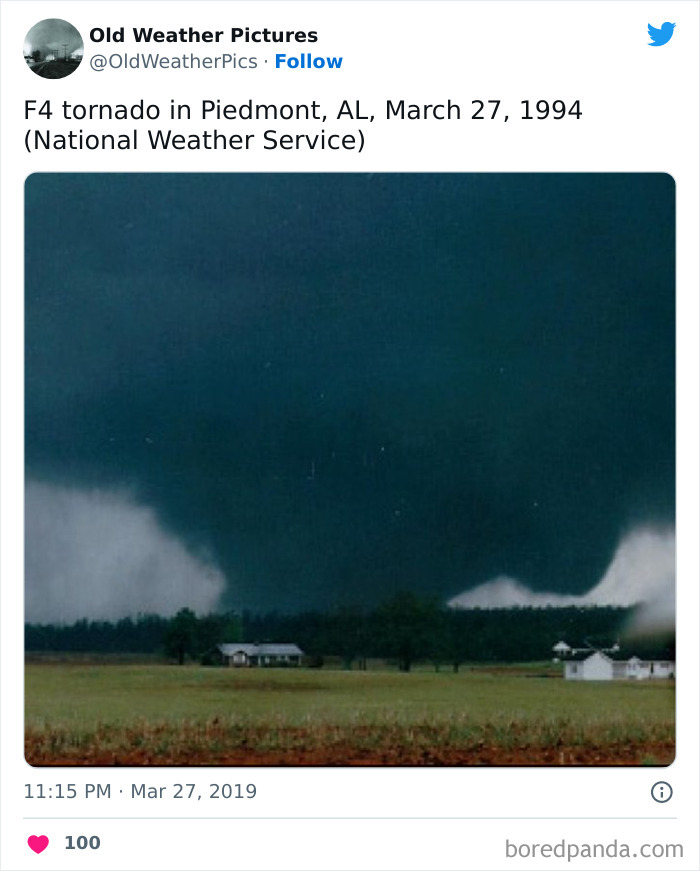
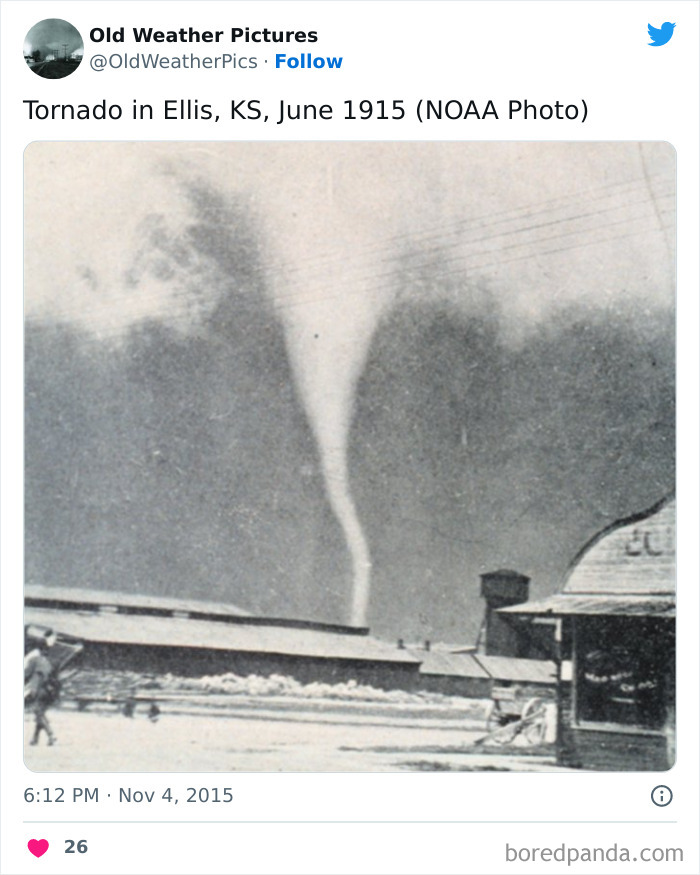
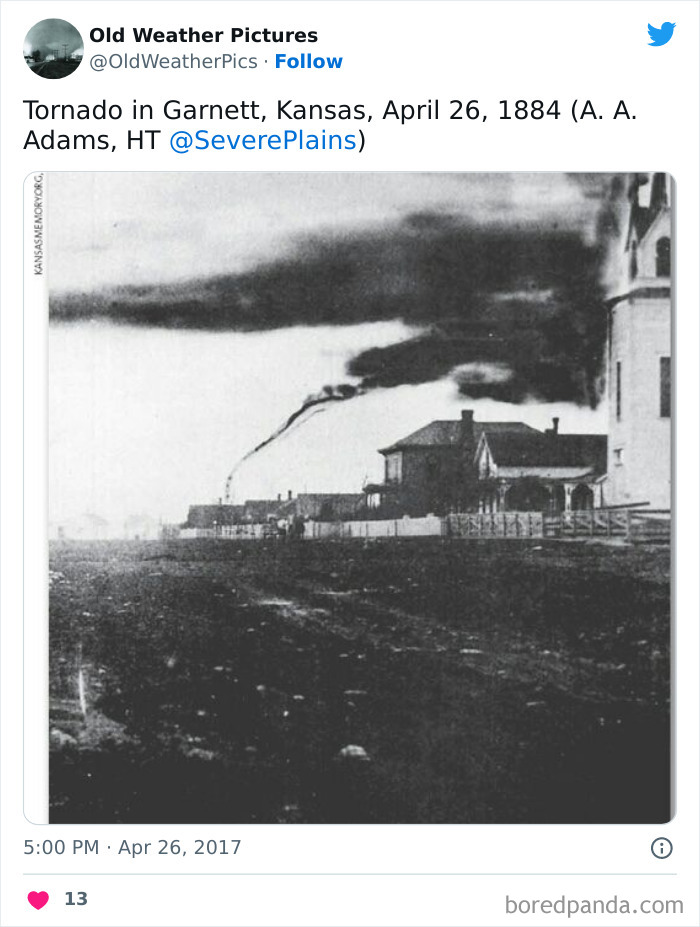
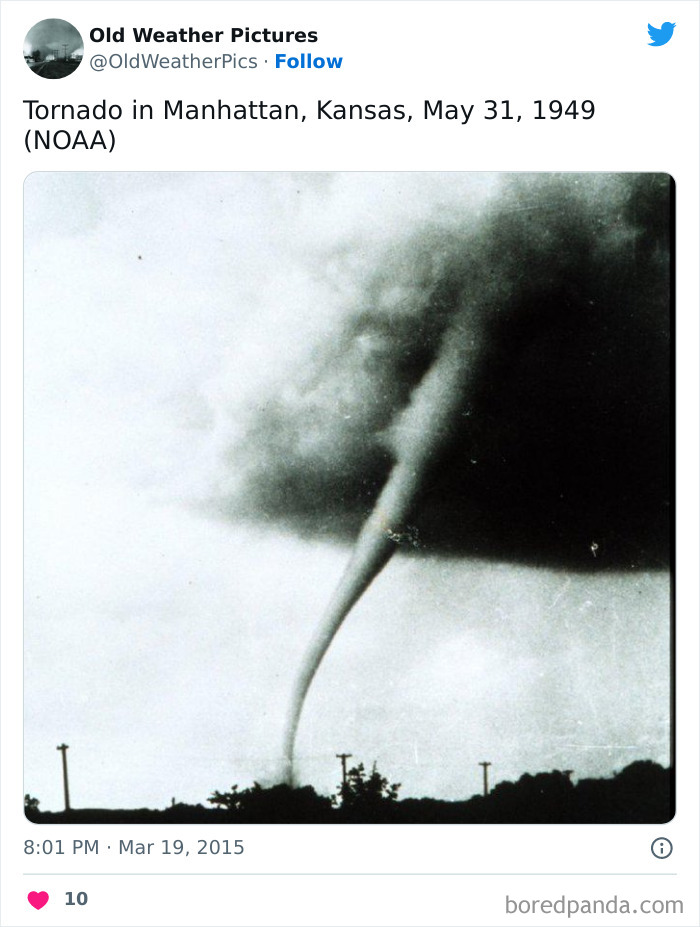
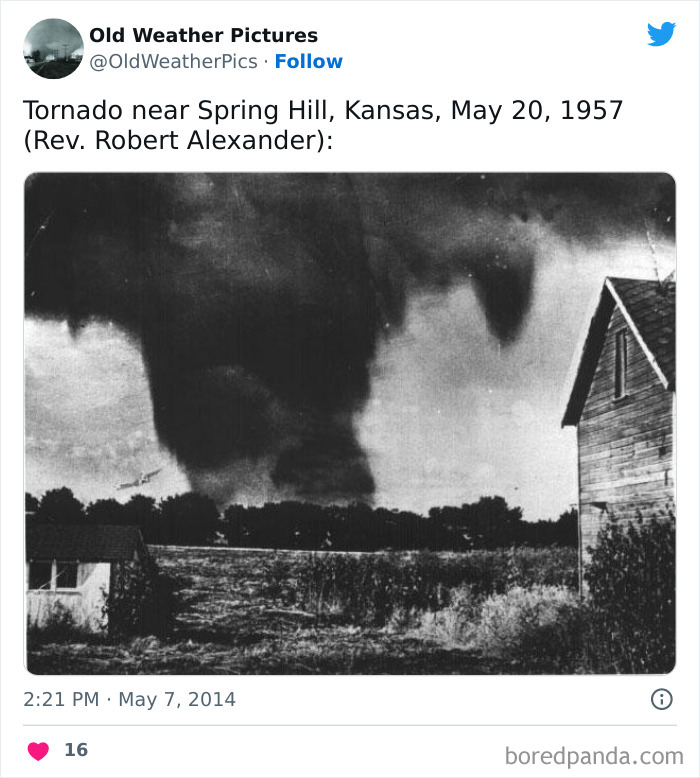
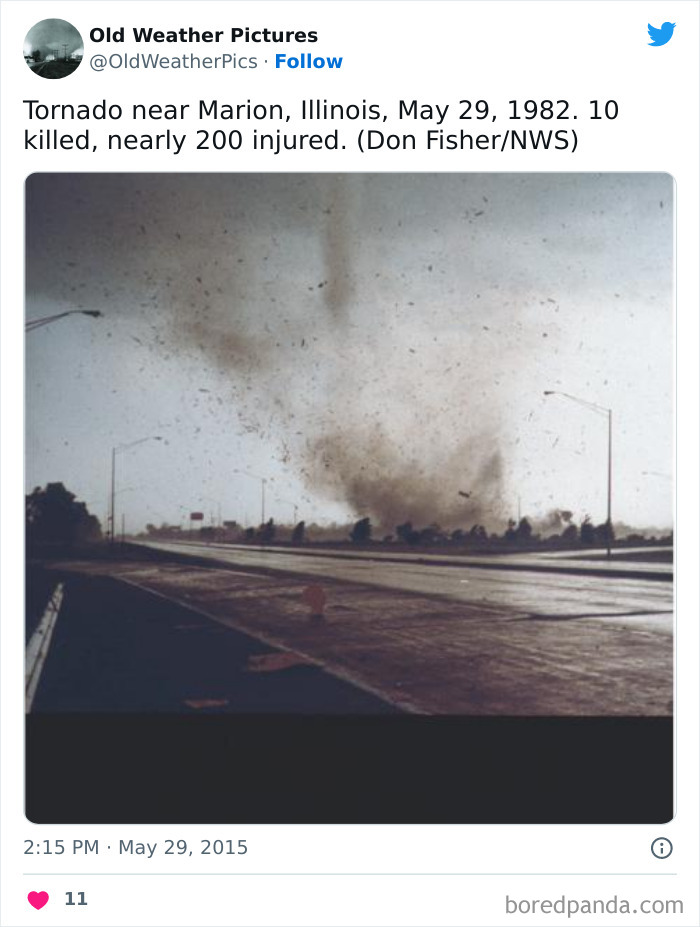
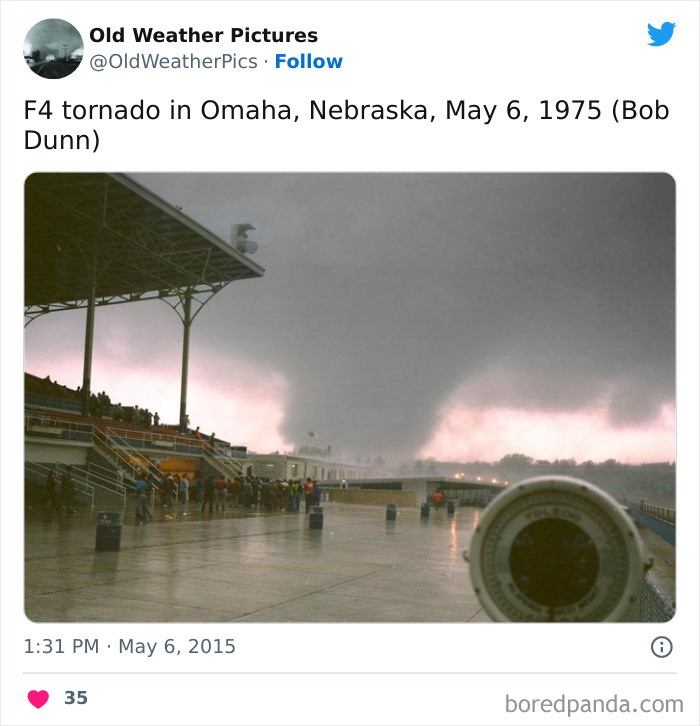
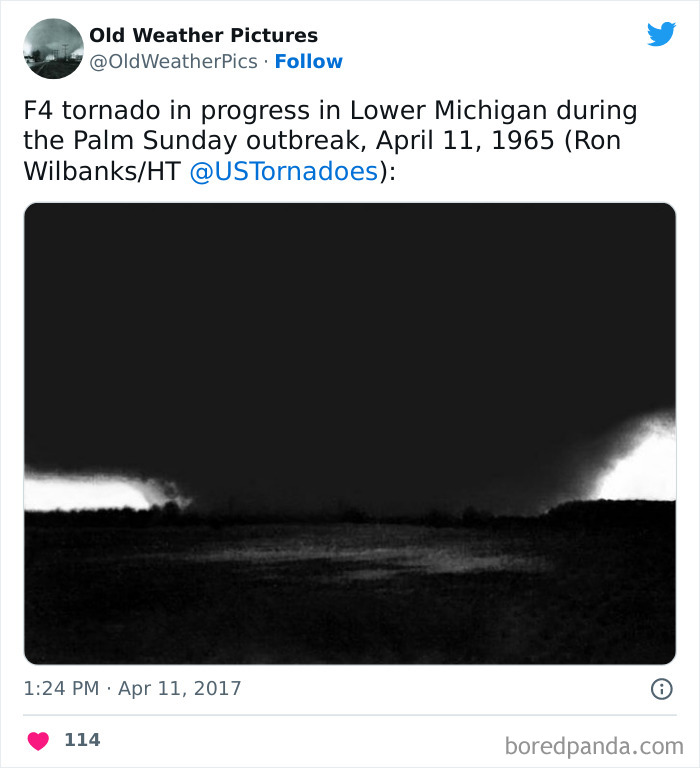
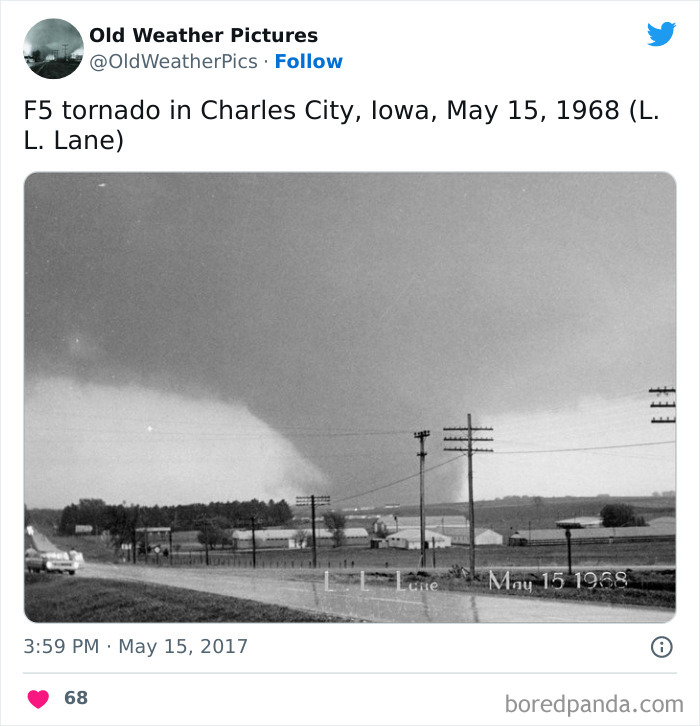
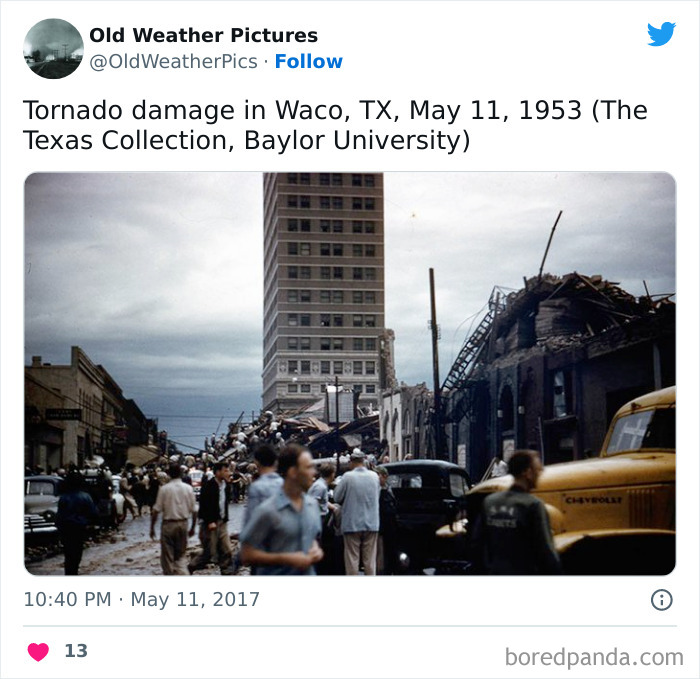
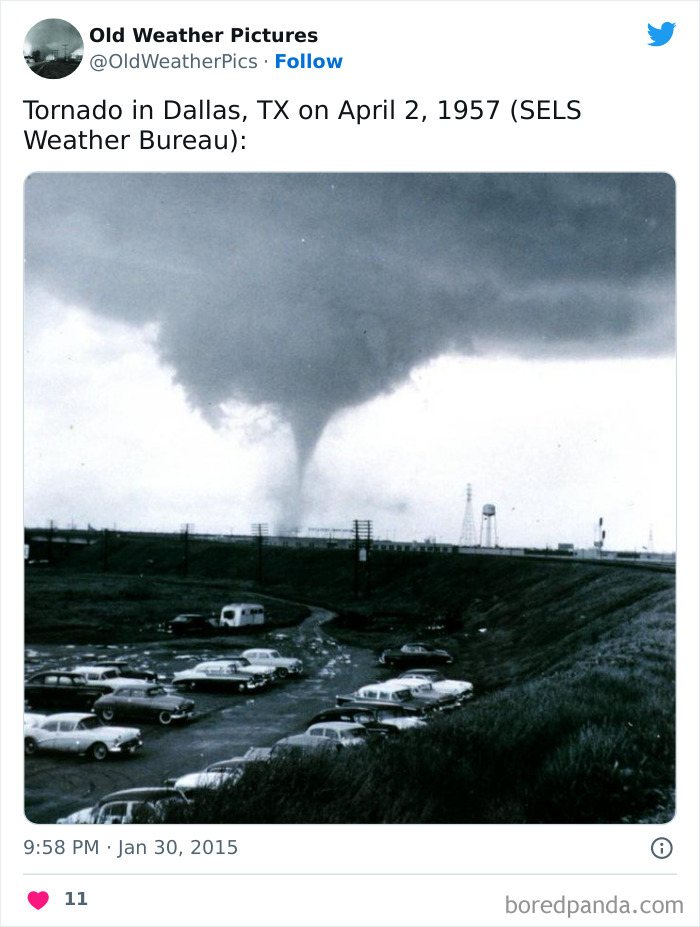
GUYS! LOOK! ITS A TORNADOOOOOHHHHH SNAP LAY DOWN FLAT FOR YOUR LIVES!!!
In the US, average temperatures have risen across the contiguous 48 states since 1901, with an increased rate of warming over the past 30 years.
Nine of the top ten warmest years on record have occurred since 1998. Average global temperatures show a similar trend, and all of the top 10 warmest years on record worldwide have occurred since 2005. Within the United States, temperatures in parts of the North, the West, and Alaska have increased the most.
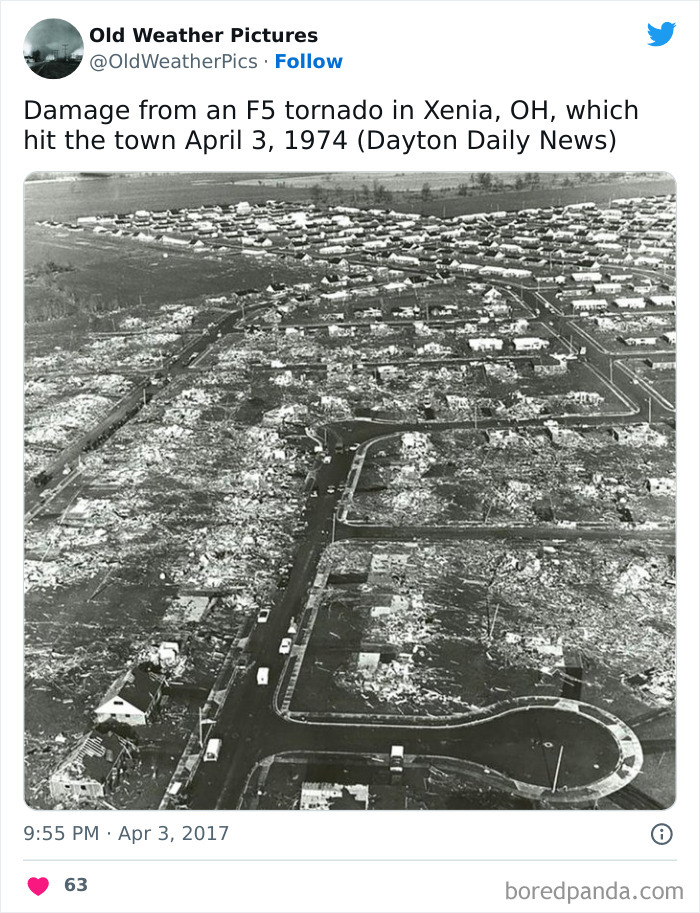
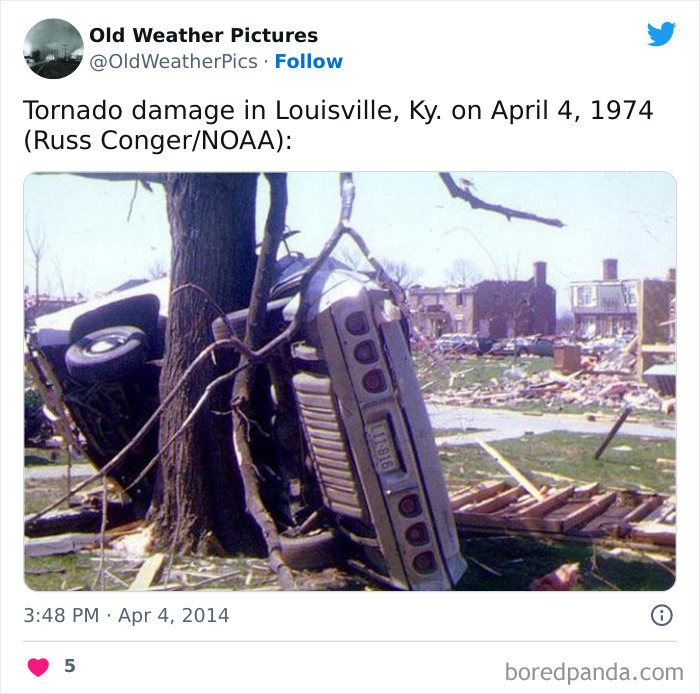
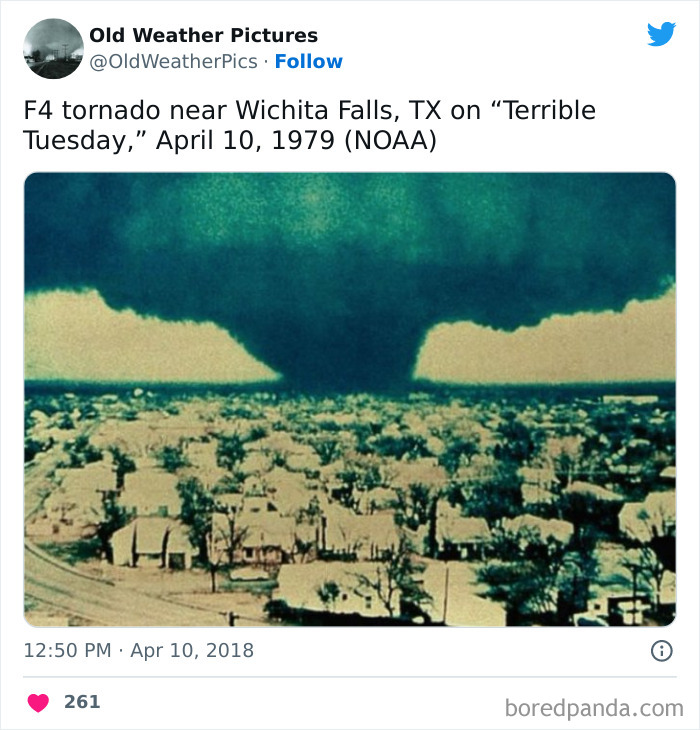
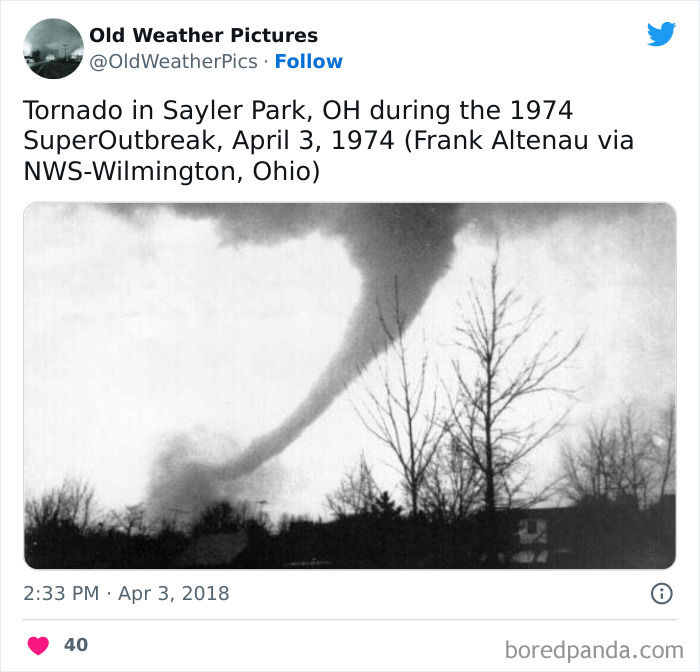
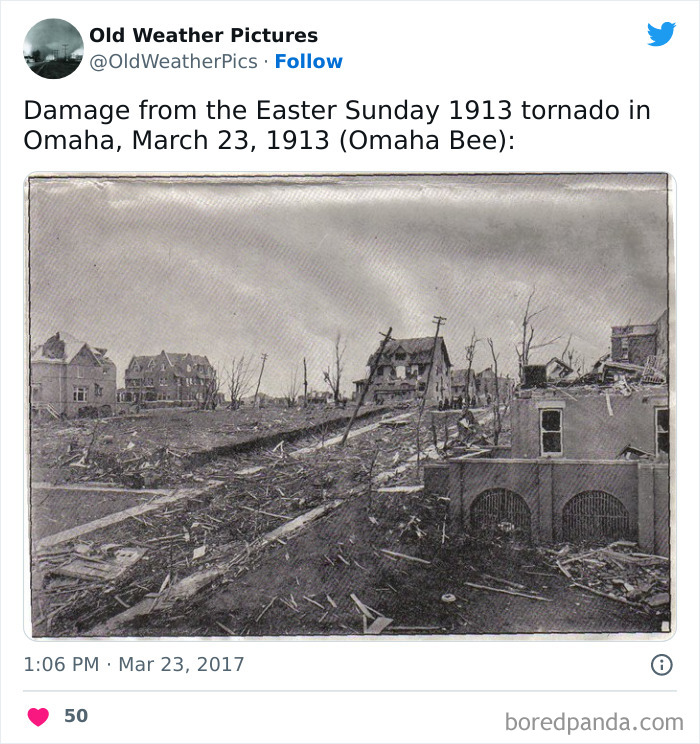
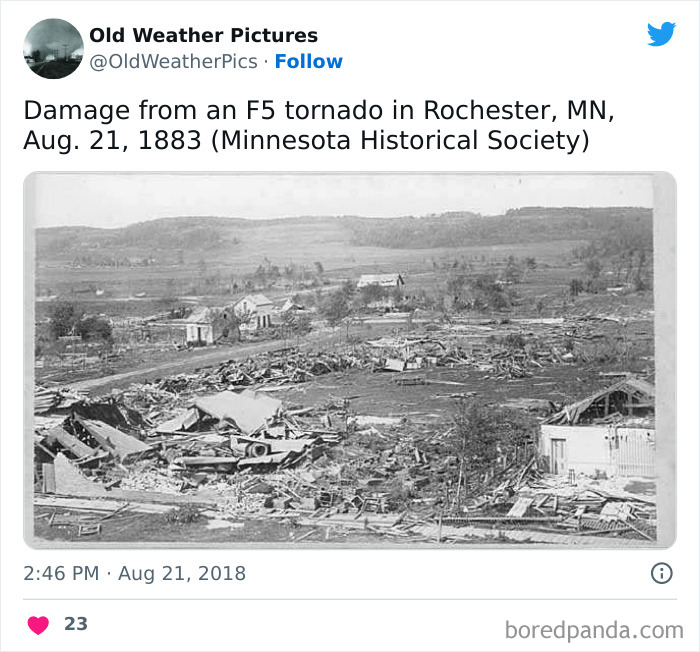
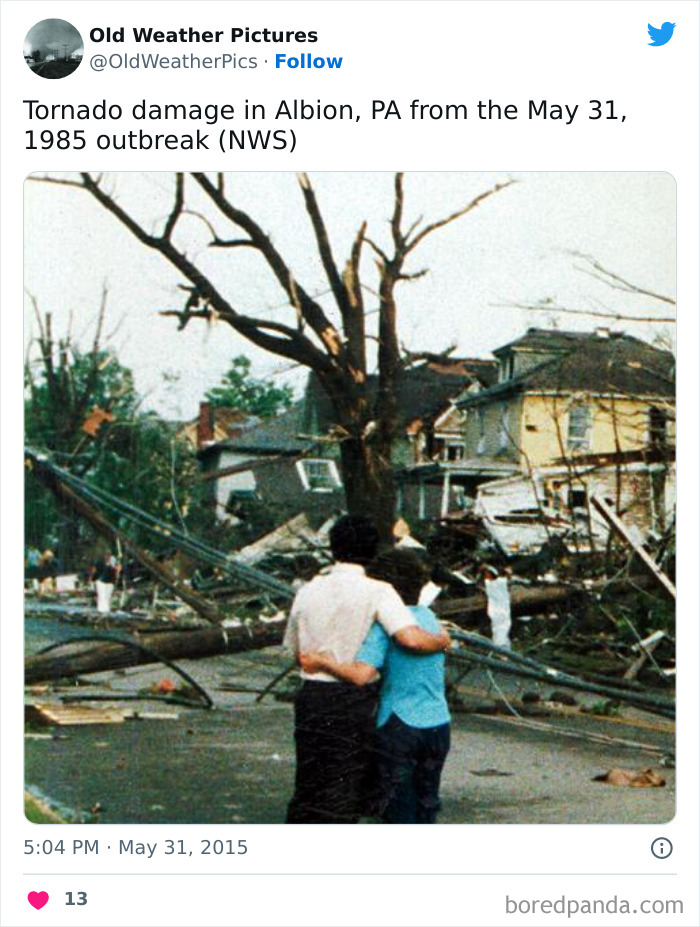
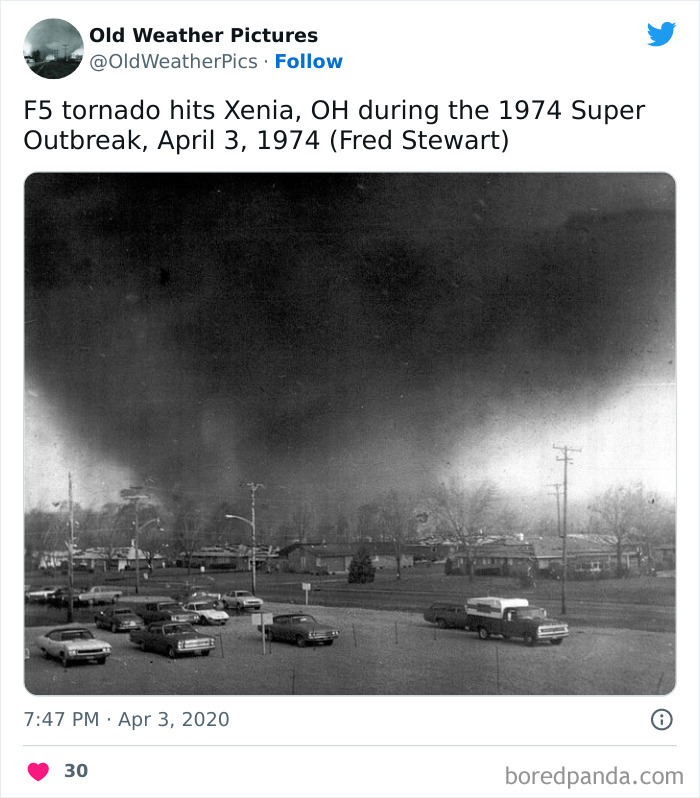
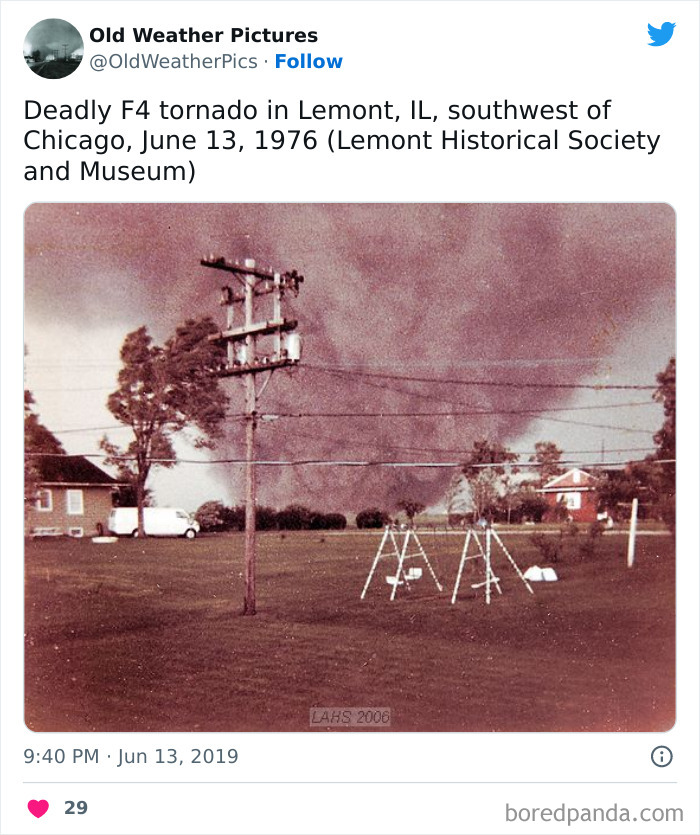
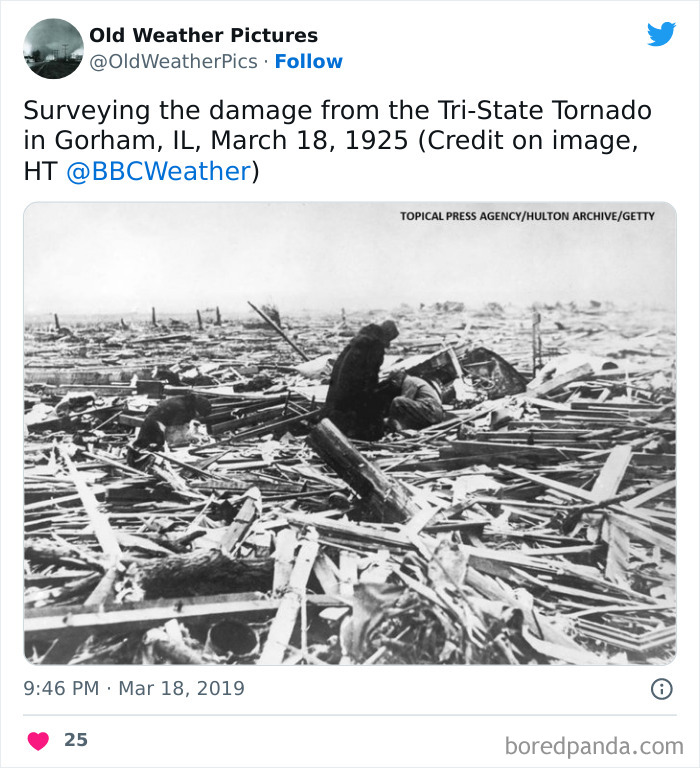
If you drive down Main St in Xenia you can see how one side of the street has older buildings and the other side is all post-1974 buildings.
As the Earth warms overall, average temperatures increase throughout the year, but the increases may be larger in certain seasons than in others.
Since 1896, average winter temperatures across the contiguous 48 states have increased by nearly 3°F. Spring temperatures have increased by about 2°F, while summer and fall temperatures have increased by about 1.5°F.
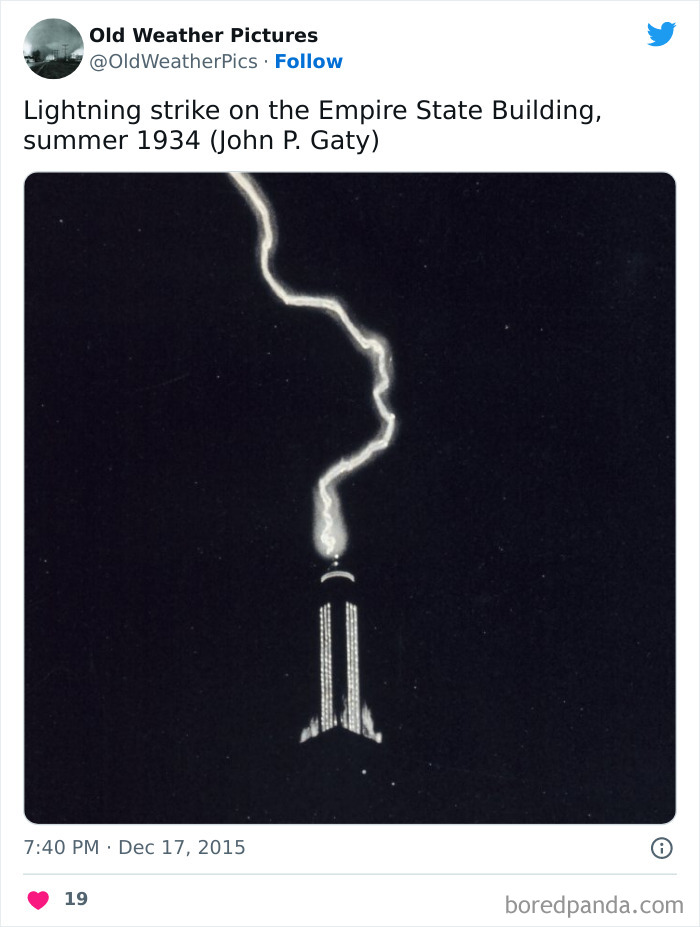
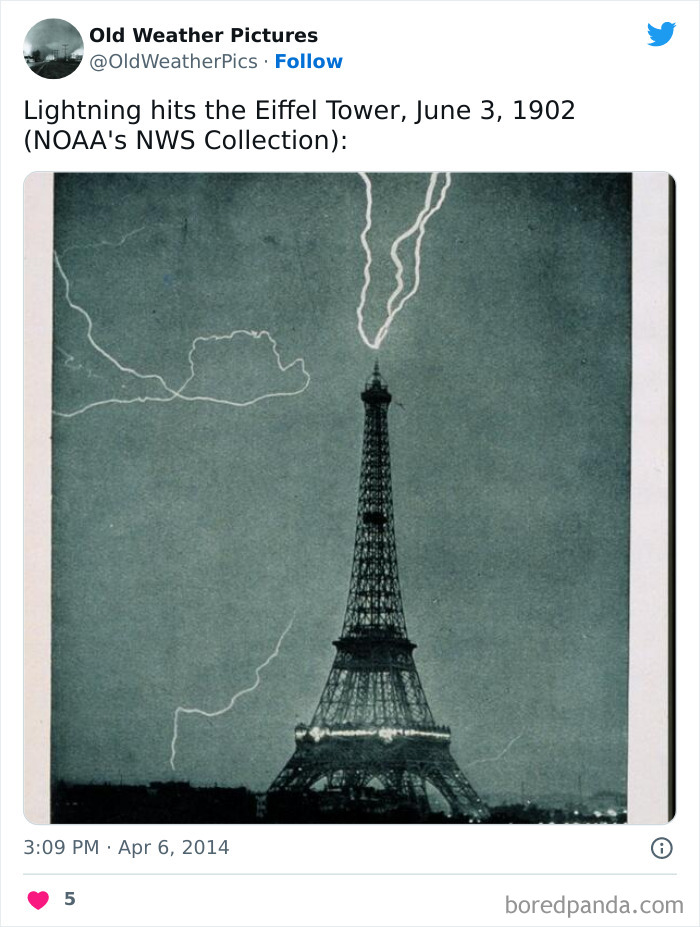
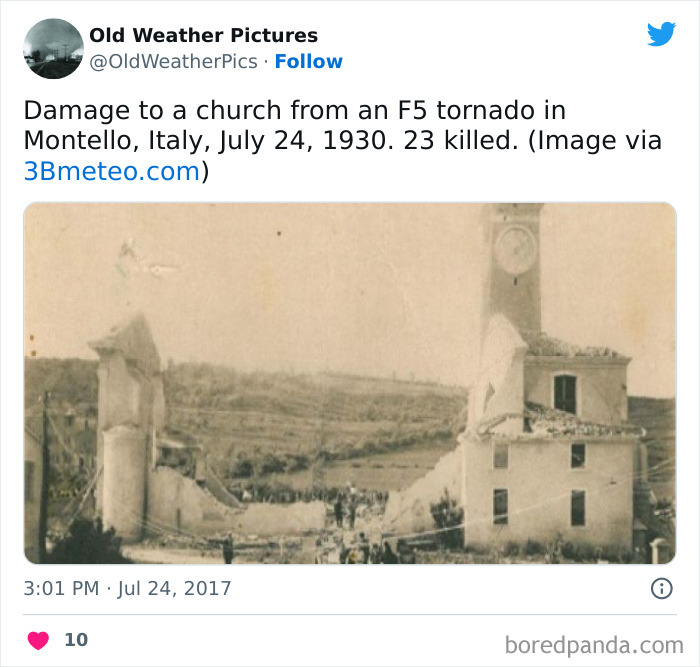
Ah! Some weather from somewhere else in the world! This is definitely in France, not the US!
Many extreme temperature conditions are becoming more frequent. Since the 1970s, unusually hot summer days (highs) in the US have become more common over the last few decades. Unusually hot summer nights (lows) have become more common at an even faster rate.
This trend indicates less "cooling off" at night and although the country has experienced many winters with unusually low temperatures, unusually cold winter temperatures have become less common—particularly very cold nights (lows).
Just as I started to think "almost every picture is from the USA", well well😳
Why do all these posts show bad weather only in USA. I mean there are worst weather in other parts of the world, right?
Heat waves are occurring three times more often than they did in the 1960s—about 6 per year compared with 2 per year.
The average heat wave season is 49 days longer, and individual heat waves are lasting longer and becoming more intense.
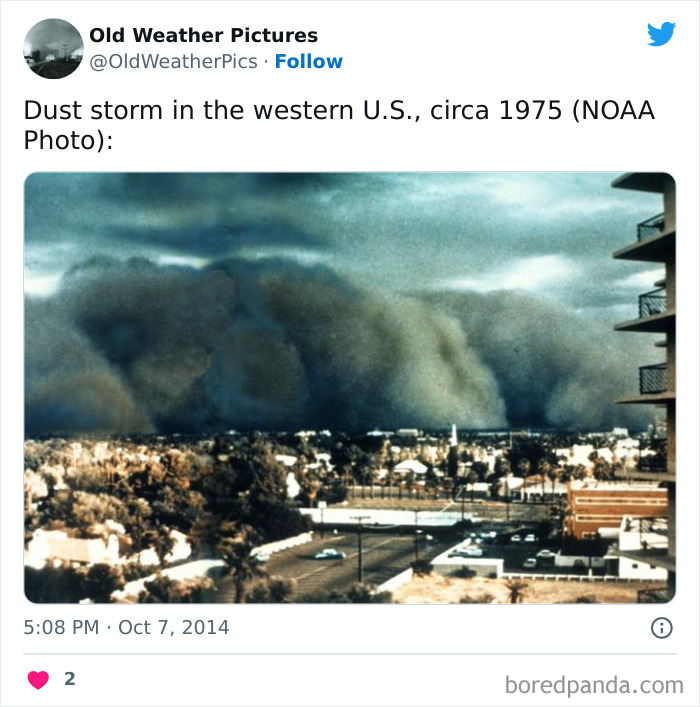
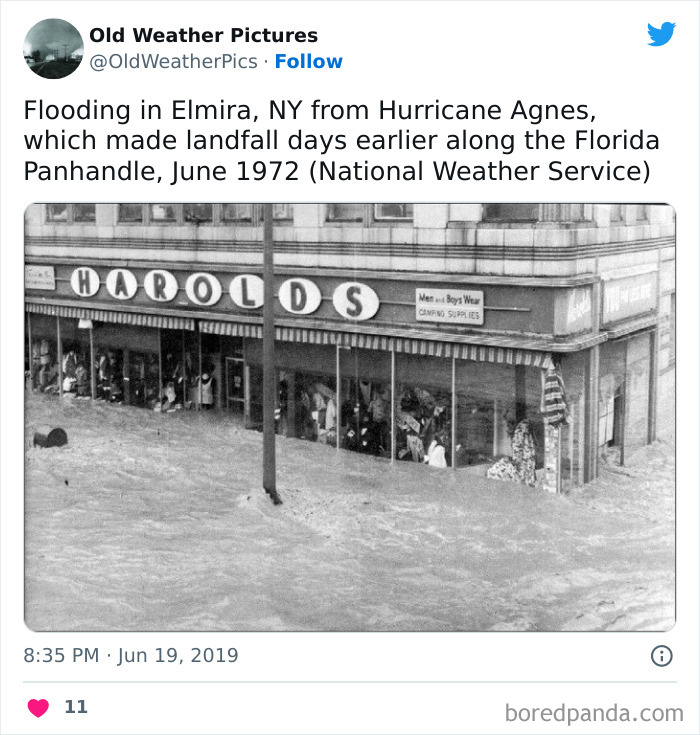
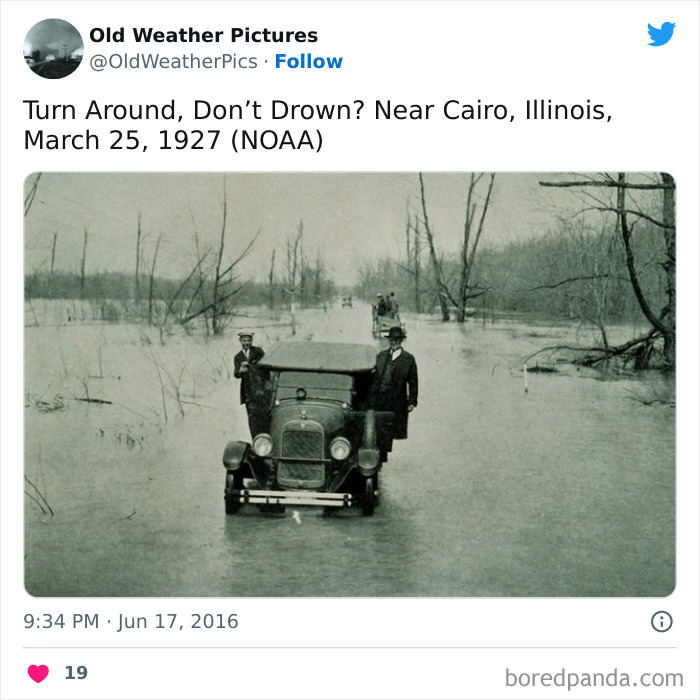
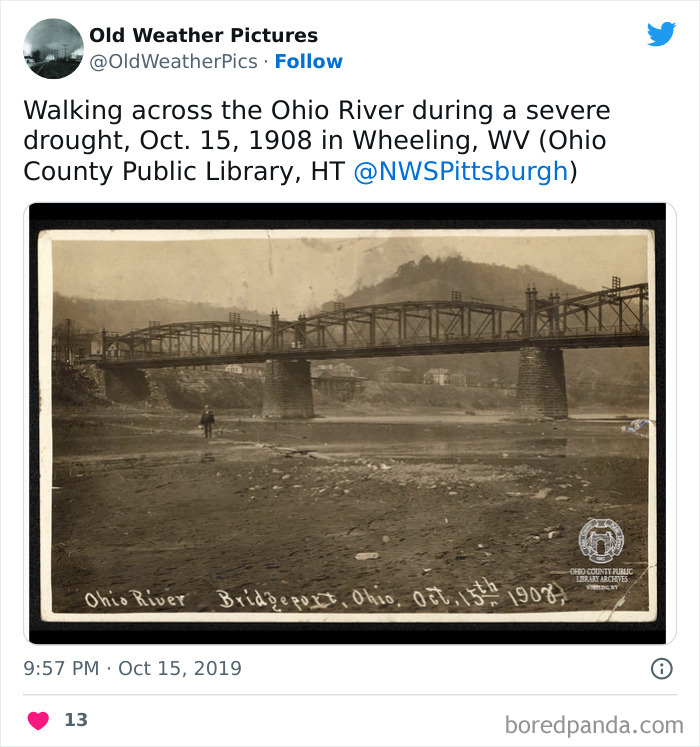
The U.S. state of Arizona has a law called “Stupid Motorist Law.” If you attempt to cross a flooded roadway and get stranded, you will be billed for emergency service rescue and towing and receive a fine up to $2k USD. We get some nasty flash floods during monsoon season and many roads become inundated with water making it impossible for drivers to cross.
A new report by top climate scientists and meteorologists describes how climate change drove unprecedented heat waves, floods, and droughts in recent years — the annual report from the American Meteorological Society (AMS) compiles the leading science about the role of climate change in extreme weather.
"It's a reminder that the risk of extreme events is growing, and they're affecting every corner of the world," Sarah Kapnick, the chief scientist at the National Oceanographic and Atmospheric Administration (NOAA), told NPR.
The connection between climate change and heat waves is particularly well-understood and documented because rising temperatures are relatively simple to measure and predict.
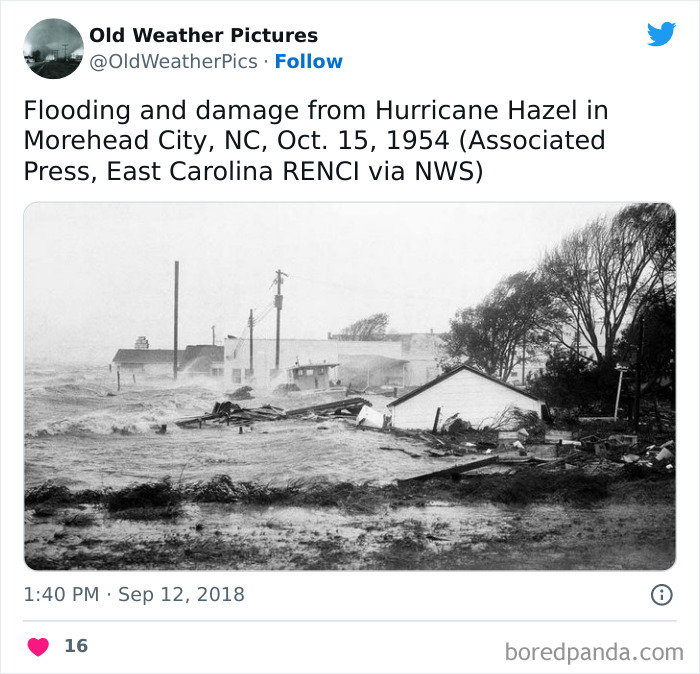
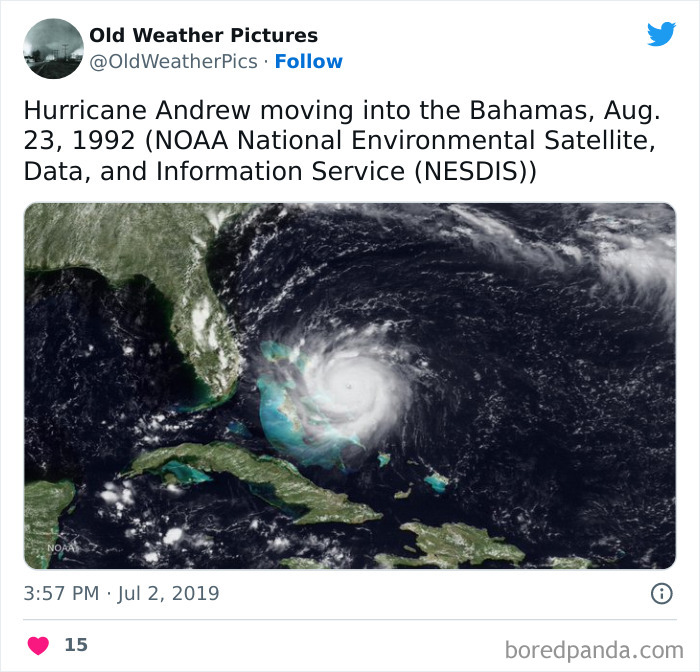
Other types of weather are more complex. Climate change affects hurricanes, for instance, in many ways (from changing the temperature of the air and the water to potentially affecting wind patterns and ocean currents), so scientists tend to focus on individual effects of a storm, such as coastal flooding and sea level rise, or inland flooding from abnormally heavy rain.
Understanding how climate change will affect extreme weather in the future, and how common these types of disasters will become as the Earth continues to heat up, is crucial for elected officials and business leaders — such research can inform decision-makers and allow them to prioritize which issues to act on first.
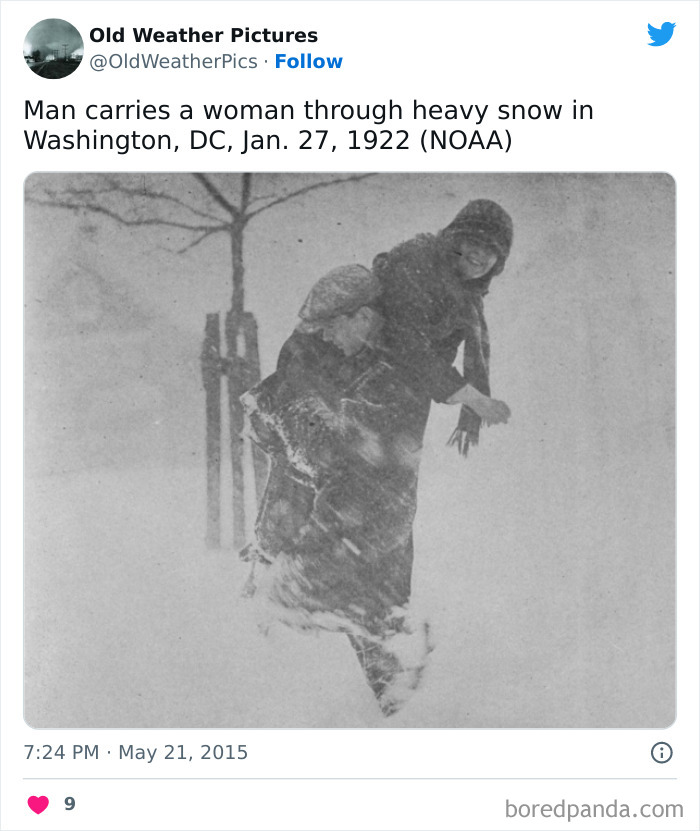
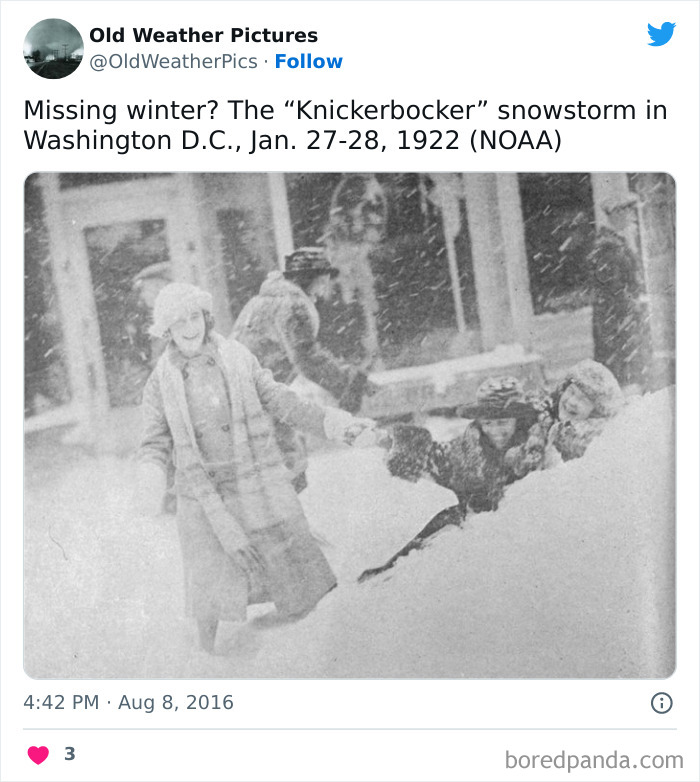
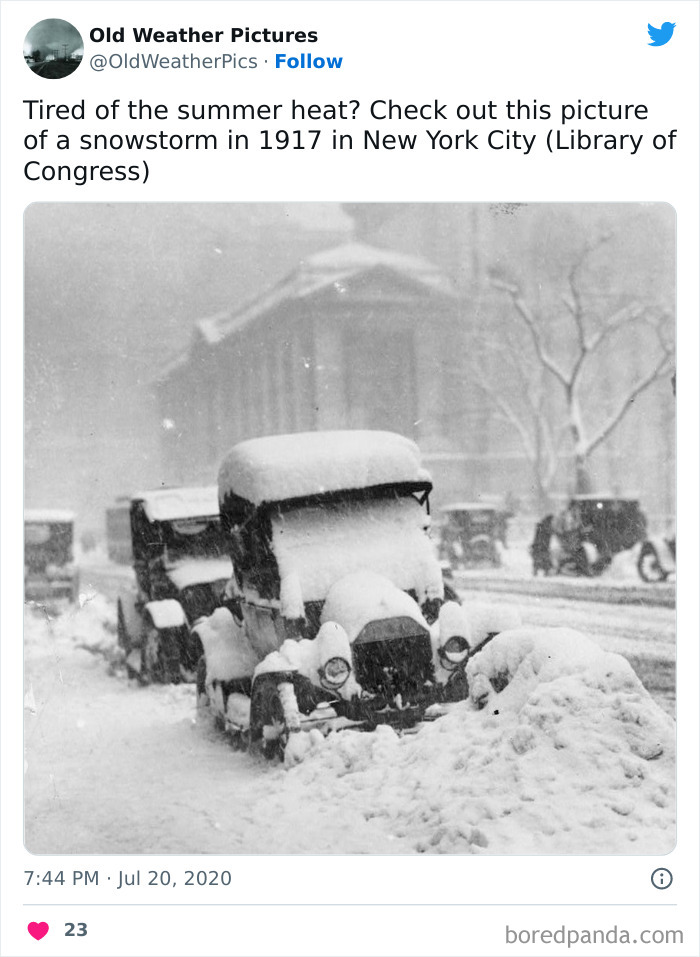
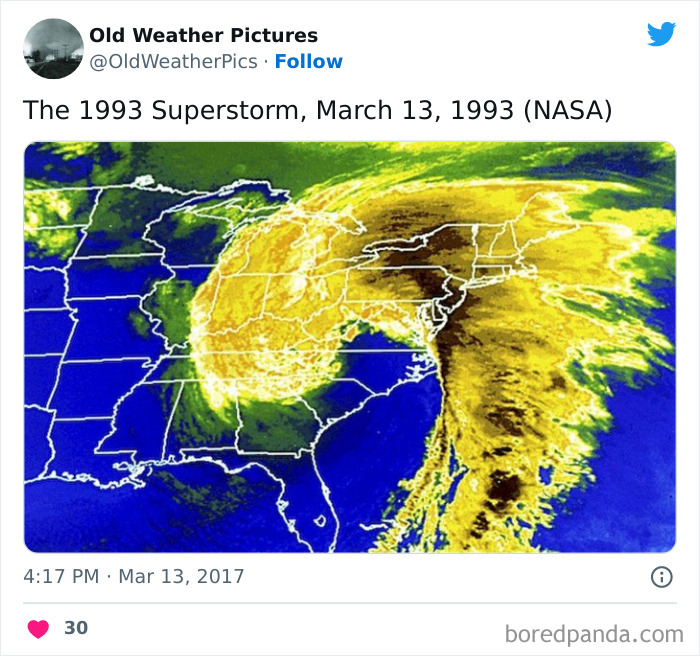
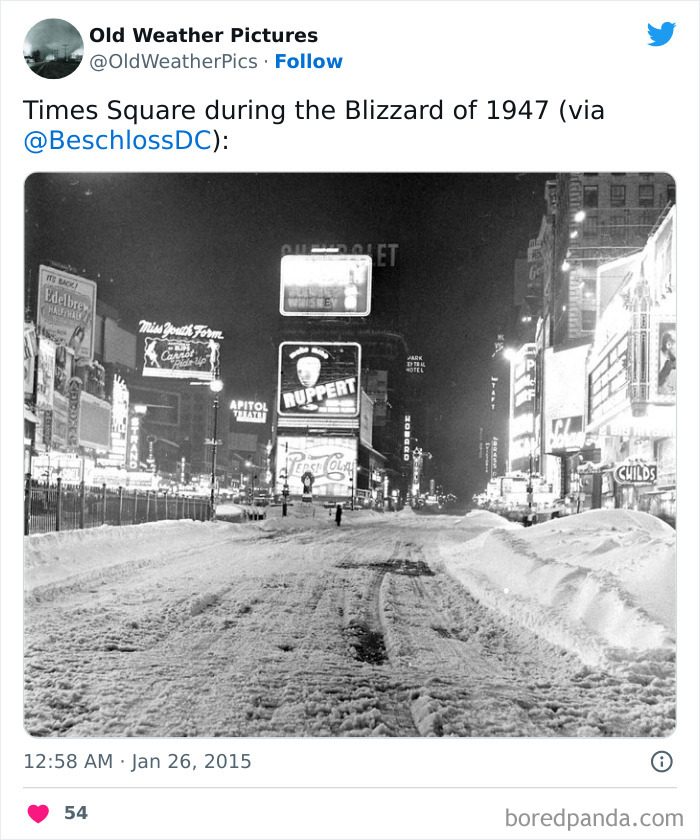
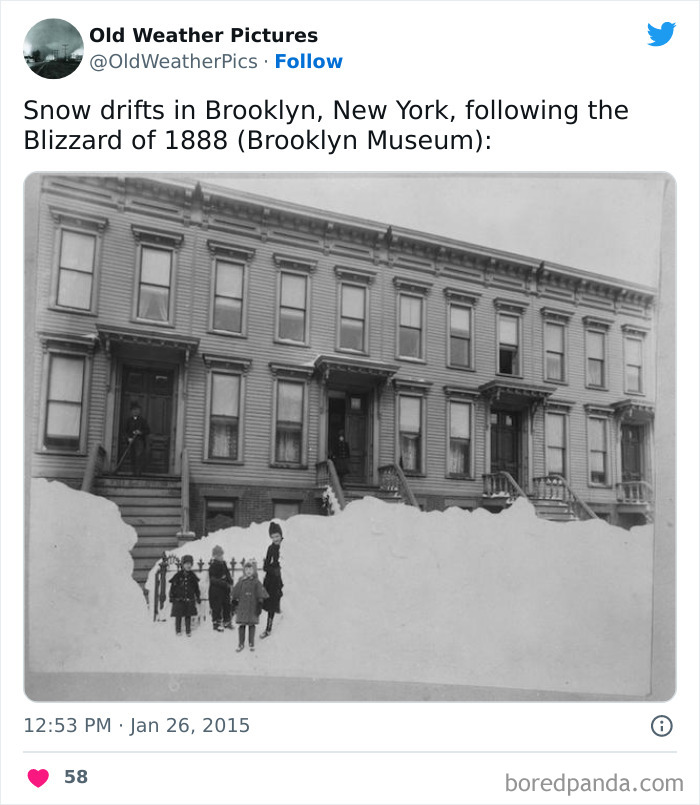
Called the 'Knickerbocker Storm' after the buildup of snow triggered the collapse of the Knickerbocker Theatre, killing 98 and injuring 133 others. I say 'triggered' rather than caused because the actual cause was poor design and construction... it is likely the theatre would have collapsed sooner or later.
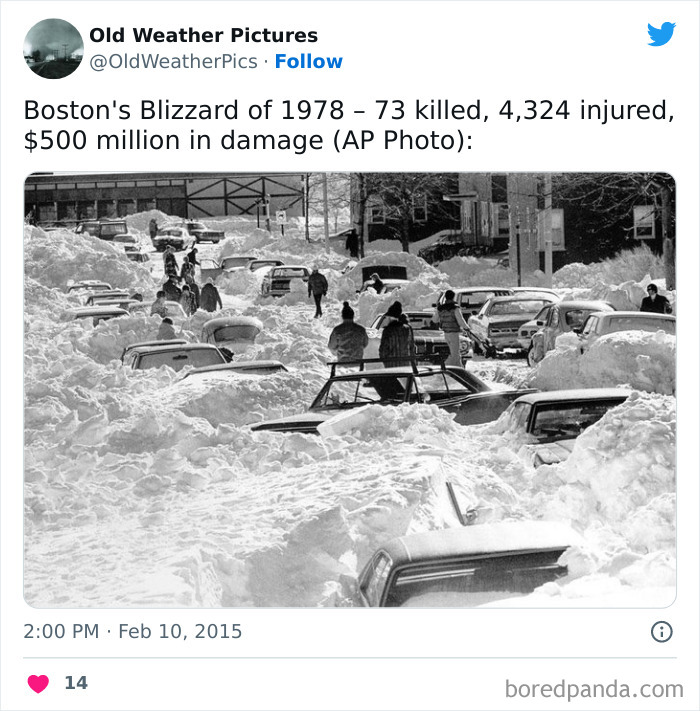
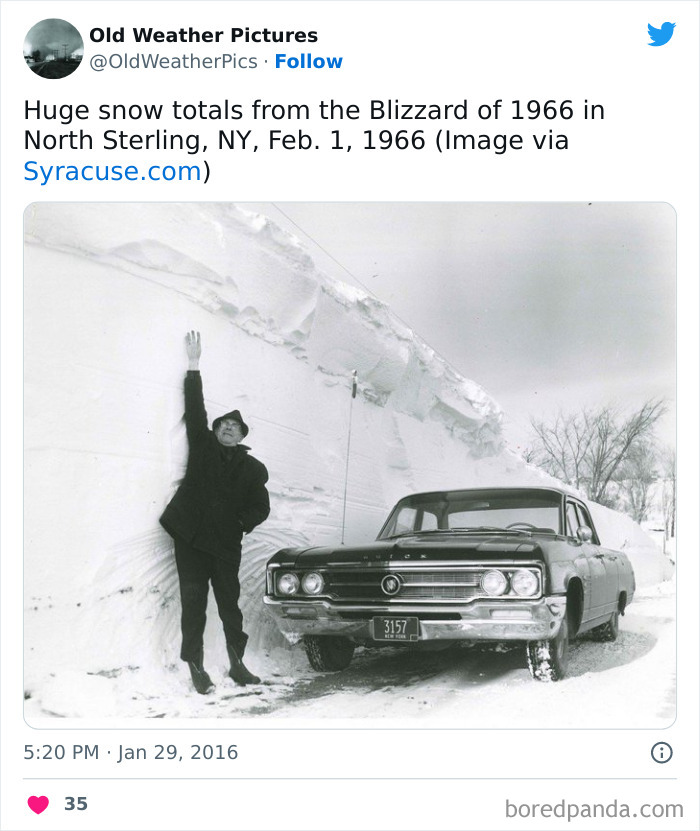
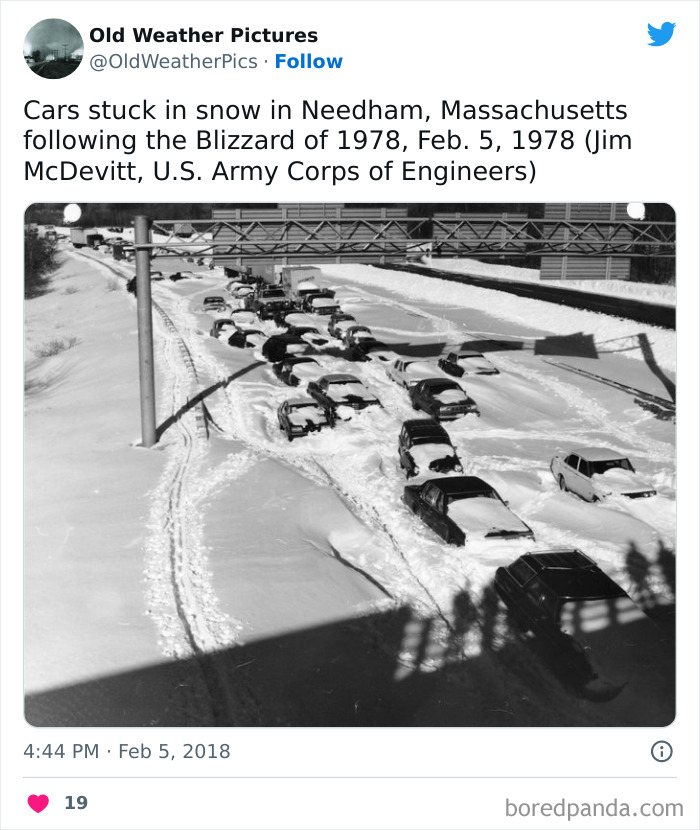
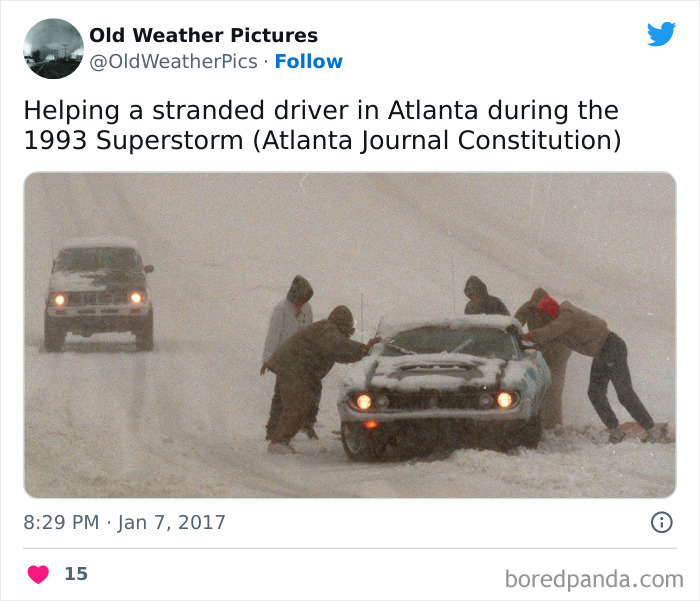
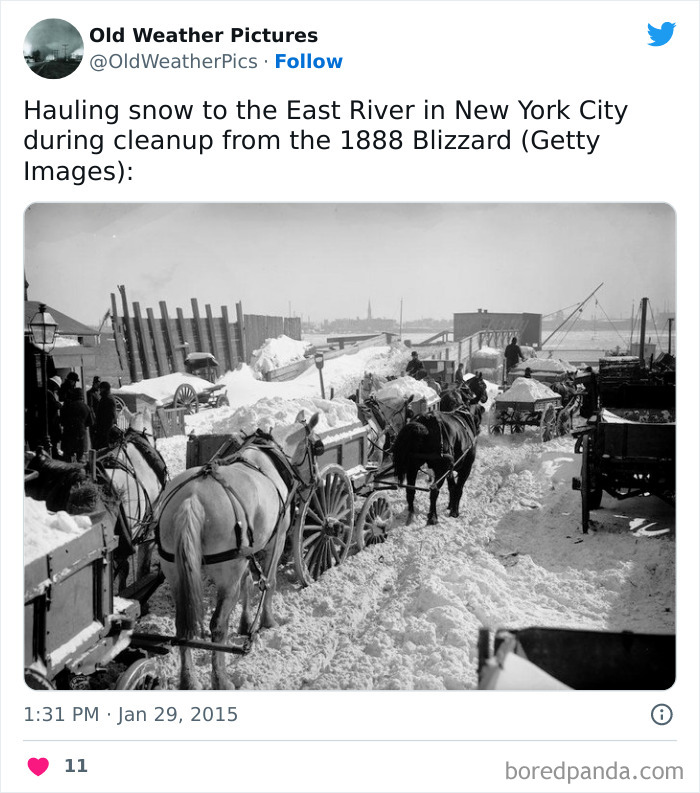
I lived in MD during that blizzard. We helped my disabled brother dig his massive 67 bel air out and cleaned the spot so he’d be able to park when he got home from work. When he did, a neighbor had parked in the spot. We asked him to move as my brother’s difficulties were known. He’s like, it’s on the street so he doesn’t own it. When it got dark, we went out and completely packed the car in deep in the snow, at least as much as we’d removed. We packed it into the wheel wells, under the bumper, in the tailpipe. Then we threw about a dozen pickle barrels of icy w cold water. Which encased it quite thoroughly. He had to have known we did it but never heard anything. (Parker’s Remorse?). He didn’t get it out until it melted out about 2 weeks later.
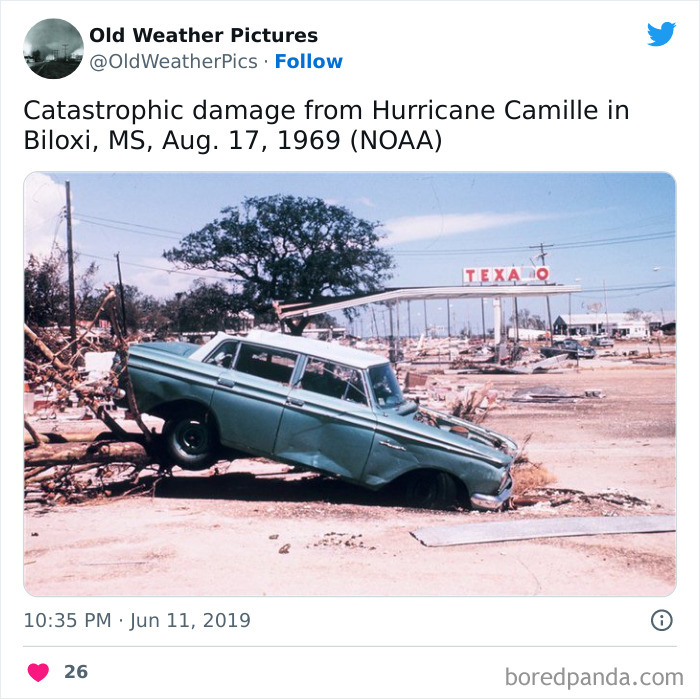
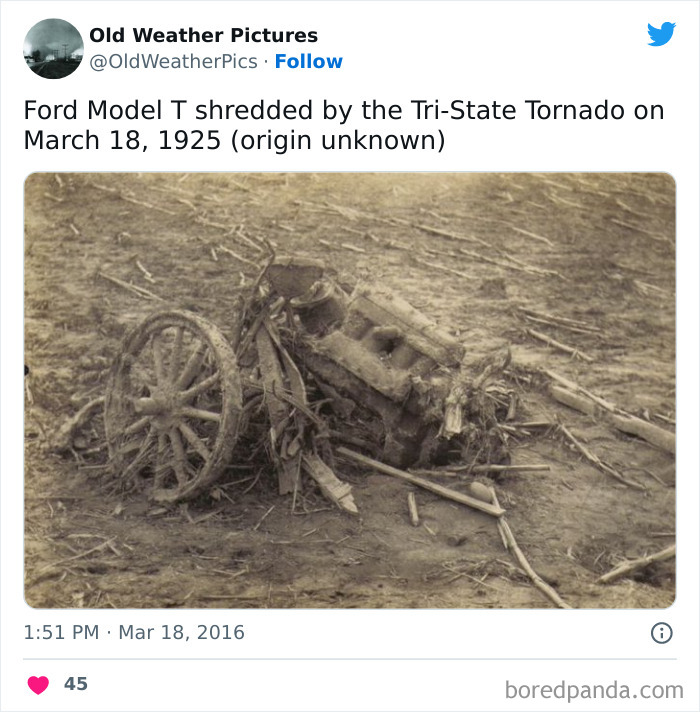
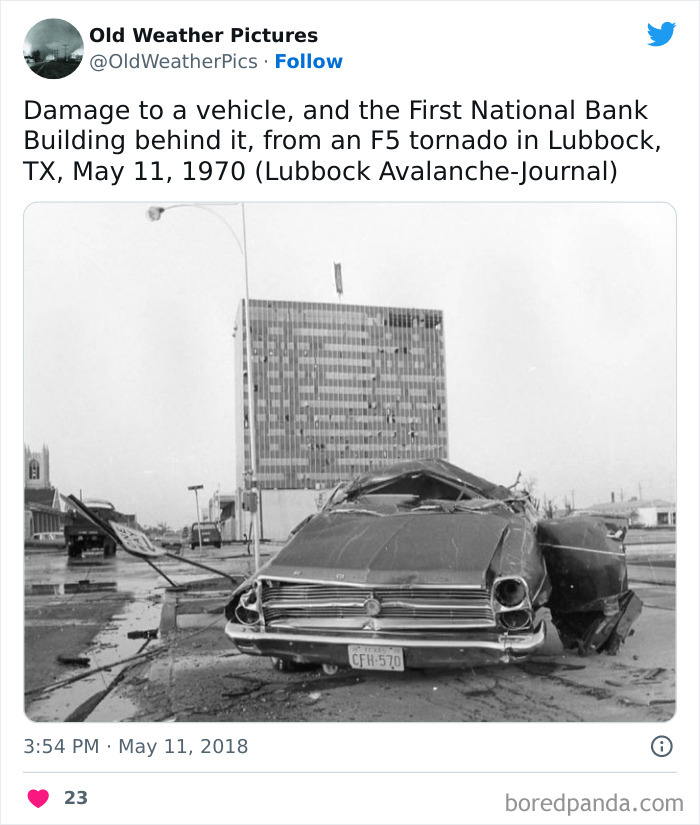
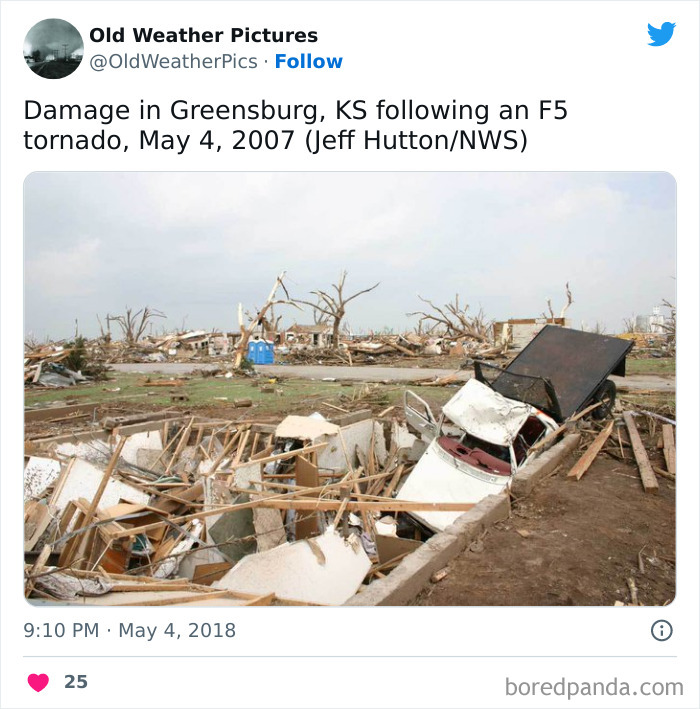
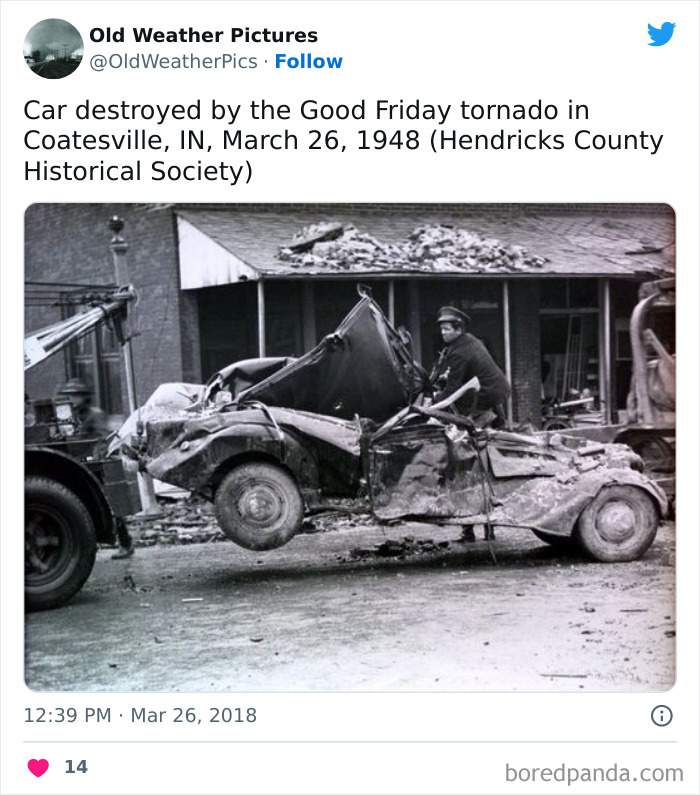
The comment section here is lonely. Here is a comment to make it a little less lonely. Also, the Ford is absolutely destroyed.
I want to make a flat earther joke but I’m too tired to think of anything 🥱
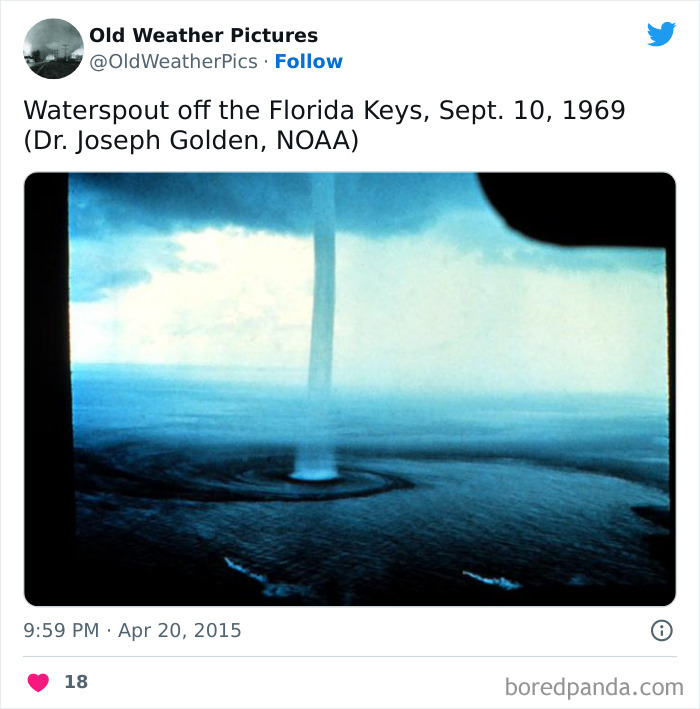
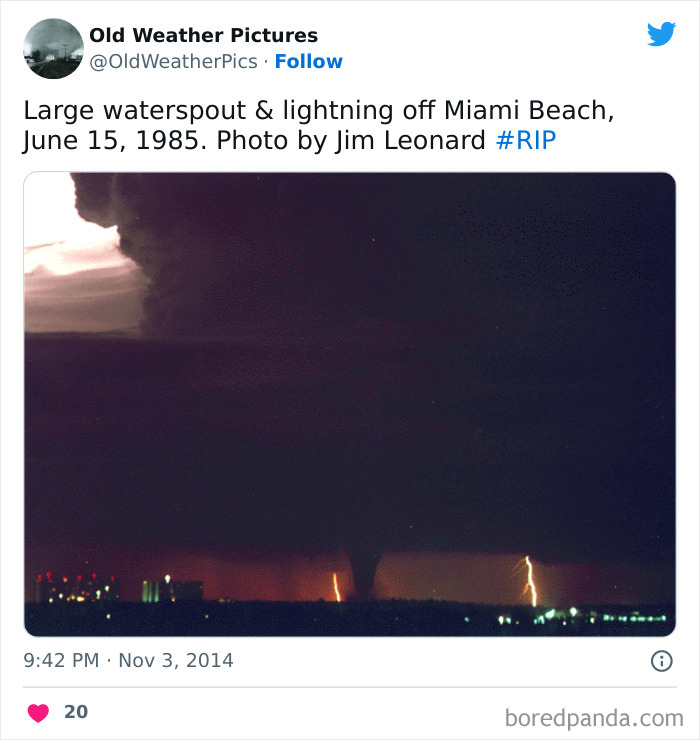
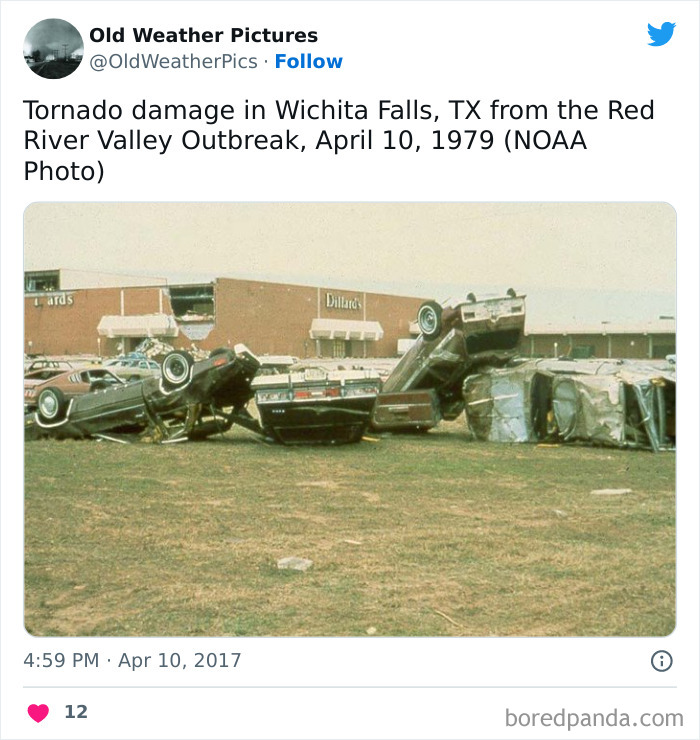
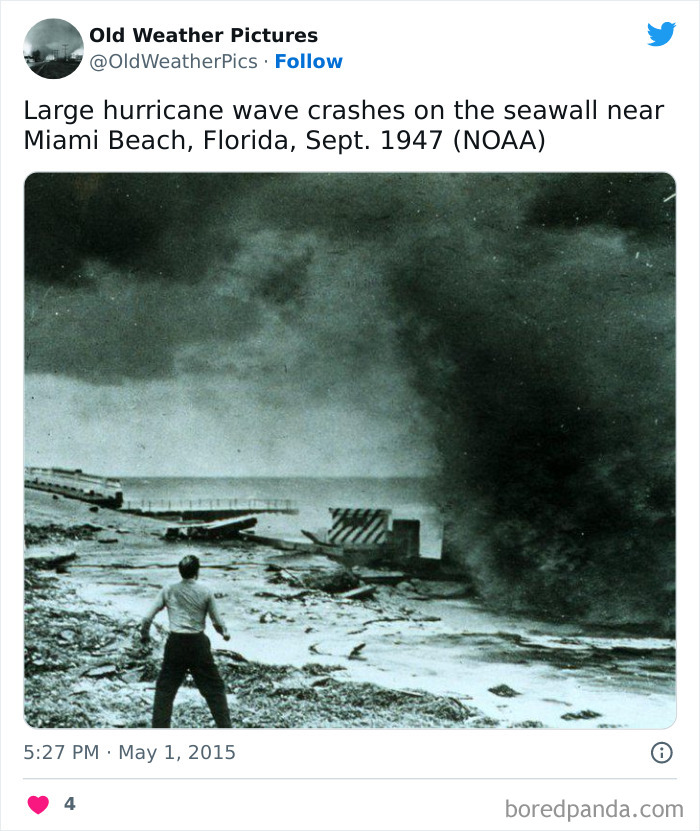
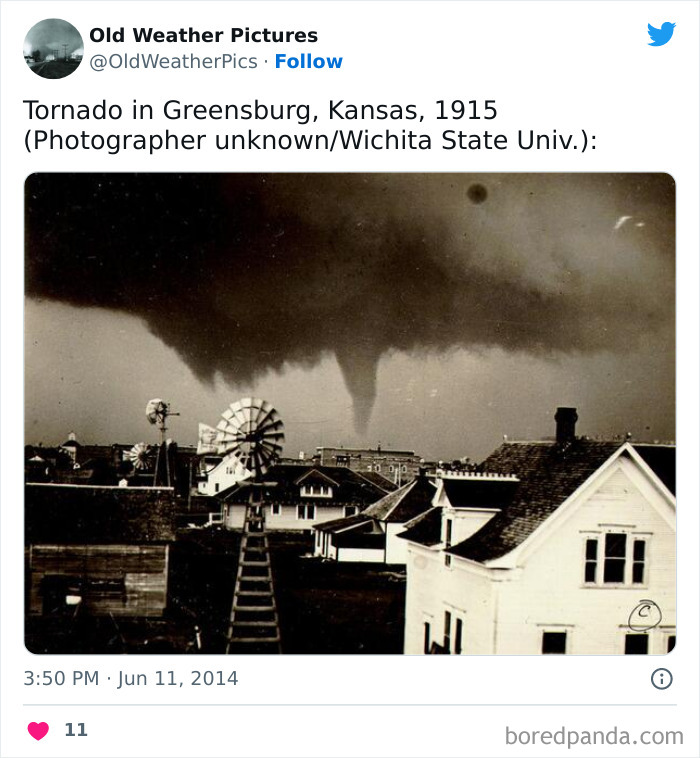
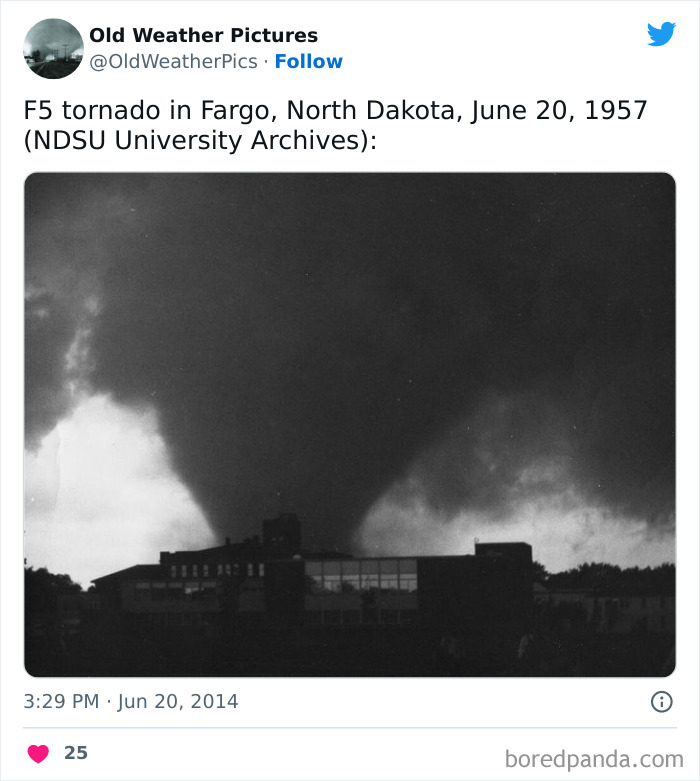
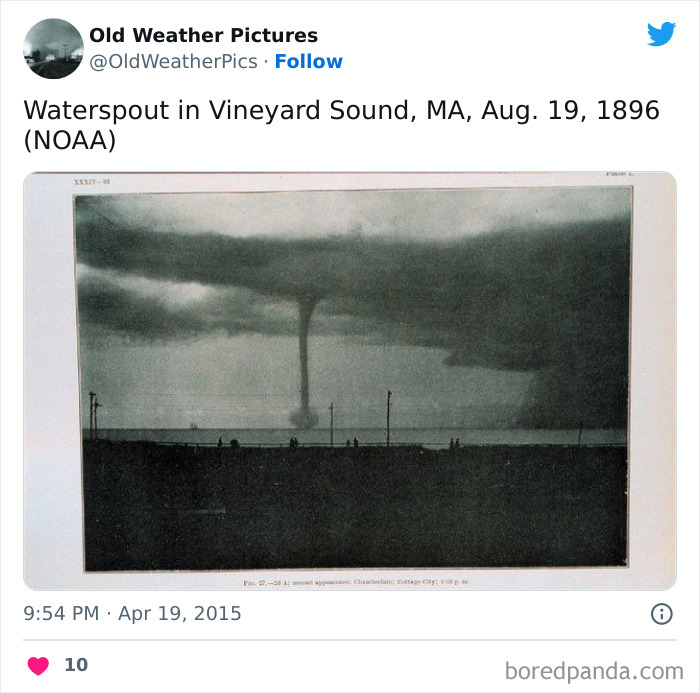
I am surprised there is not more debris in the air with something this size.
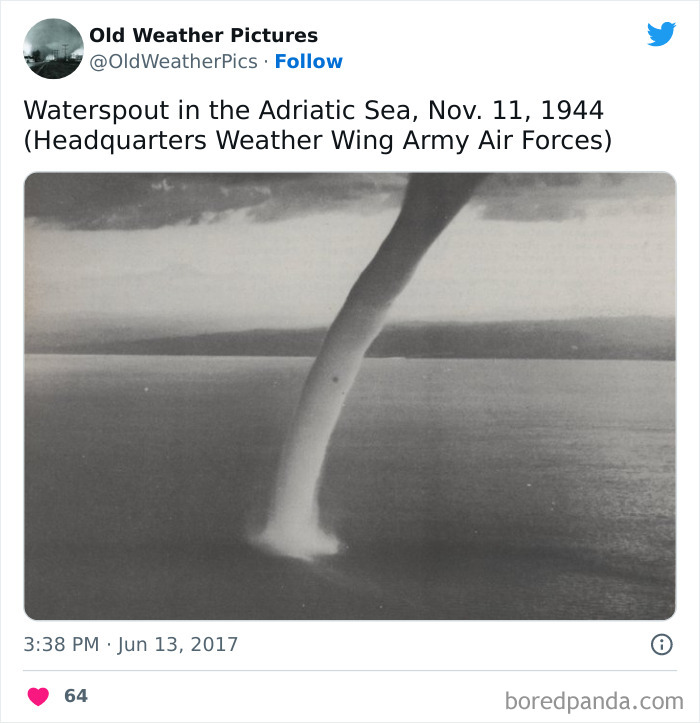
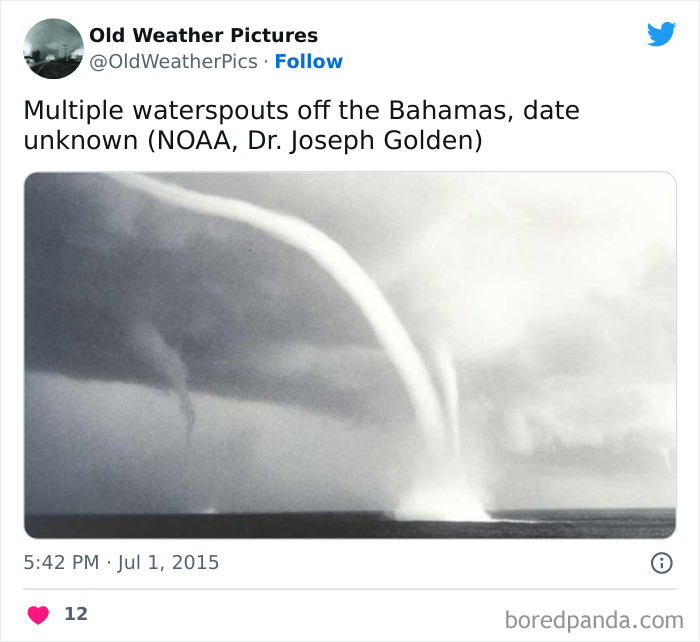
Was in Key West in USCG when Cuban boatlift started, had to get underway after a VERY powerful front moved through. Counted 11 waterspouts between harbor and seabouy..crazy
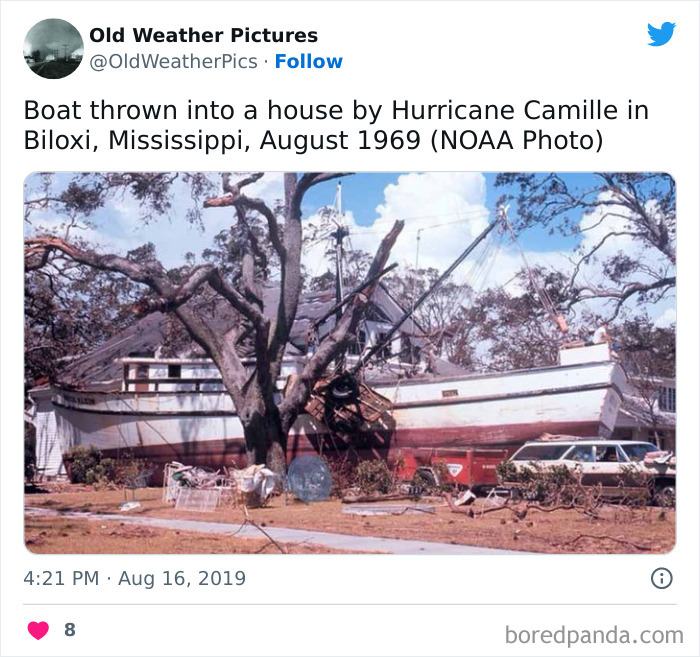
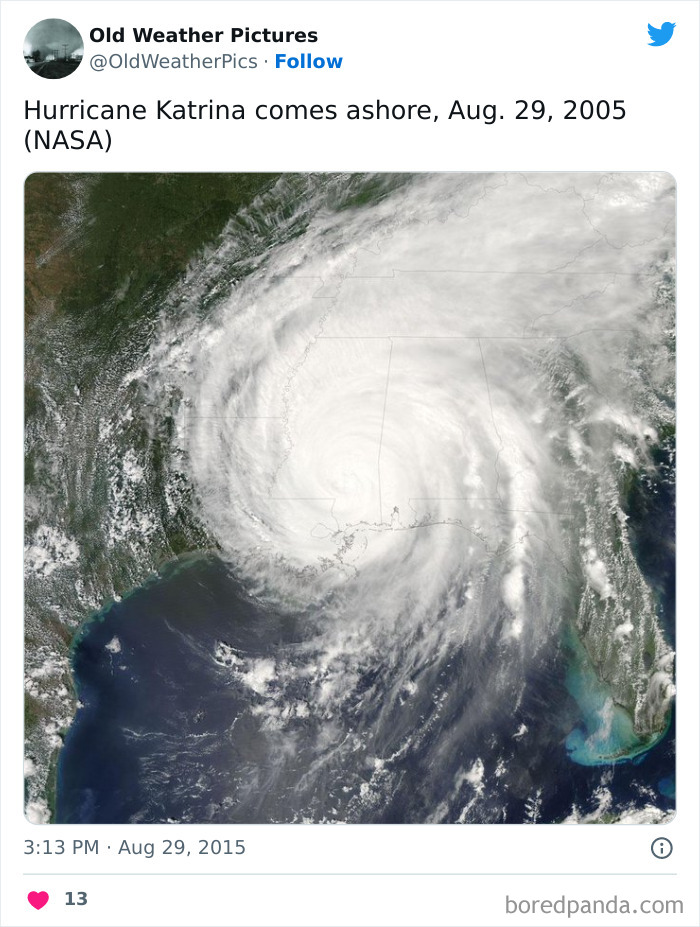
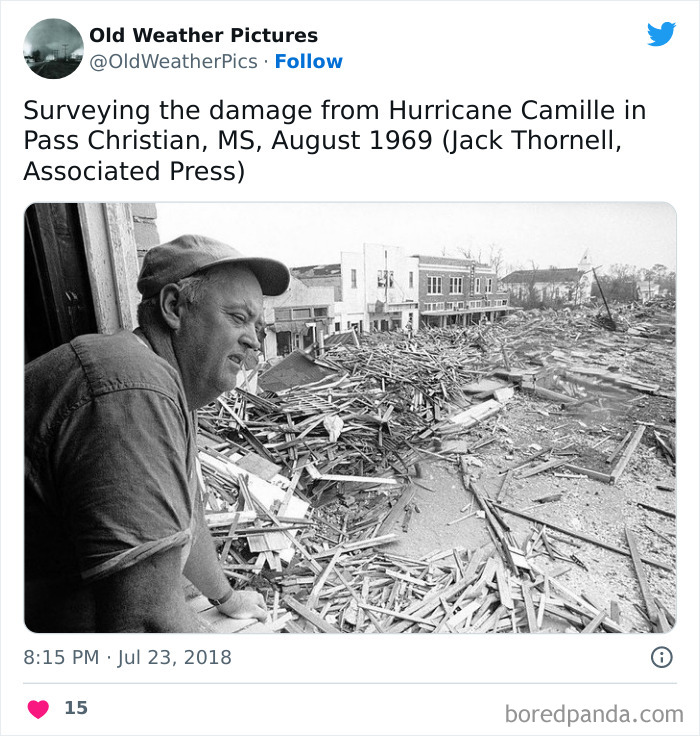
The 2004 and 2005 hurricane seasons were absolutely brutal. Seemed like every couple of weeks there was a new one.
A bit of geographical diversity and background information would have been good for this posting.
I'm guessing most of these were in the US because the government agency (NOAA) gives their photos away copyright free.
Load More Replies...It should be named "American Weather History " because this account only talks about weather in America.
Dang, I wonder when we stole the eiffel tower and annexed alberta
Load More Replies...Heres a nice little interactive map just to show the number of tornados we really get. https://www.arcgis.com/apps/View/index.html?appid=01672085b139432e8fe1296a743f67d7
Pretty cool. The ones on the map must just be the ones that fully touched down. A tornado ripped the roof of my house about a year ago, and there's nothing to indicate a tornado ever passed over that spot. So either not all tornadoes get recorded, or tornadoes can still do some pretty serious damage when they're still up in the air.
Load More Replies...A bit of geographical diversity and background information would have been good for this posting.
I'm guessing most of these were in the US because the government agency (NOAA) gives their photos away copyright free.
Load More Replies...It should be named "American Weather History " because this account only talks about weather in America.
Dang, I wonder when we stole the eiffel tower and annexed alberta
Load More Replies...Heres a nice little interactive map just to show the number of tornados we really get. https://www.arcgis.com/apps/View/index.html?appid=01672085b139432e8fe1296a743f67d7
Pretty cool. The ones on the map must just be the ones that fully touched down. A tornado ripped the roof of my house about a year ago, and there's nothing to indicate a tornado ever passed over that spot. So either not all tornadoes get recorded, or tornadoes can still do some pretty serious damage when they're still up in the air.
Load More Replies...
 Dark Mode

 No fees, cancel anytime


