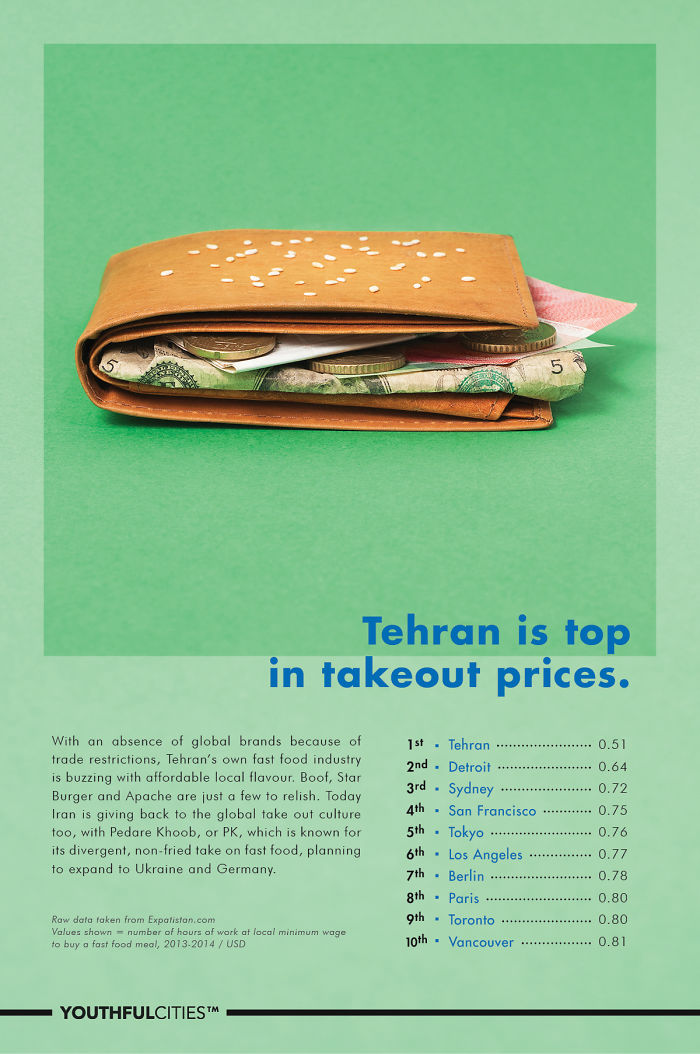
Colorful, Creative Posters That Teach You About Affordability In Large Cities
Often, data & numbers can be boring. Creating simple creative content to pair up with data isn’t as easy as it seems! I was challenged with just that when I was commissioned by Youthful Cities to create a poster series to elevate information.
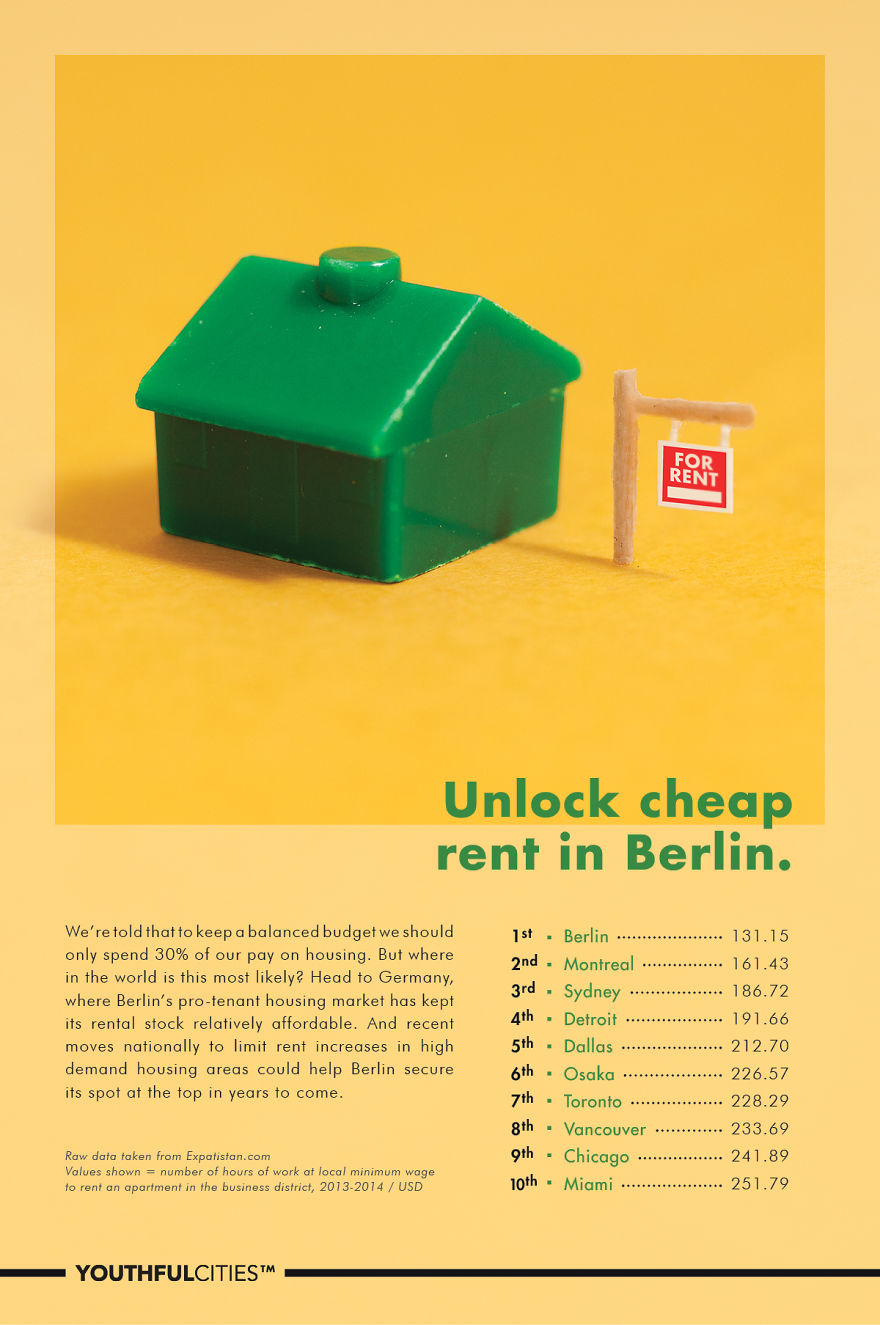
The posters rank large cities based on how affordable it is to purchase a certain item or service in comparison to the city’s minimum wage. Check out the Youthful Cities website for more information.
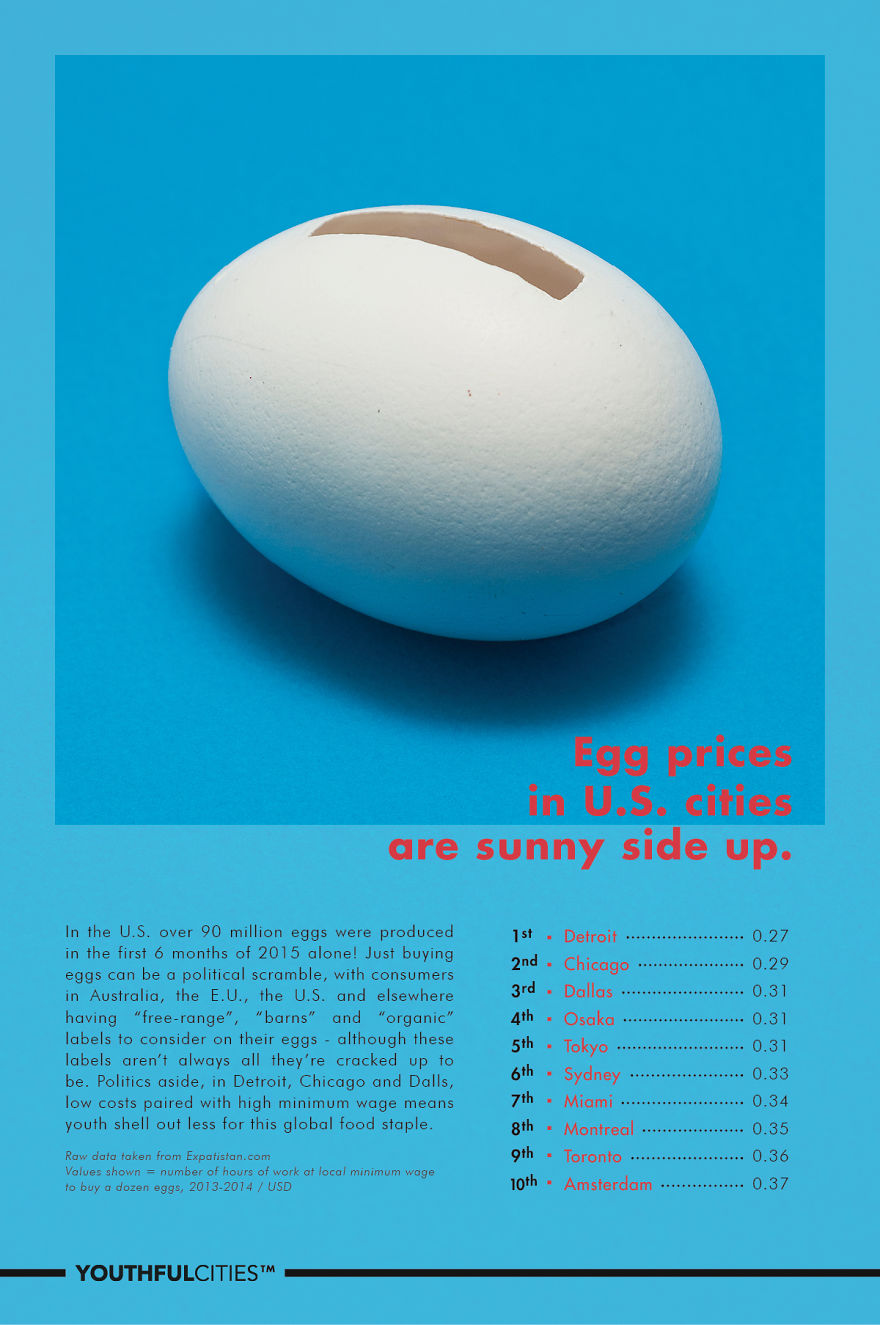
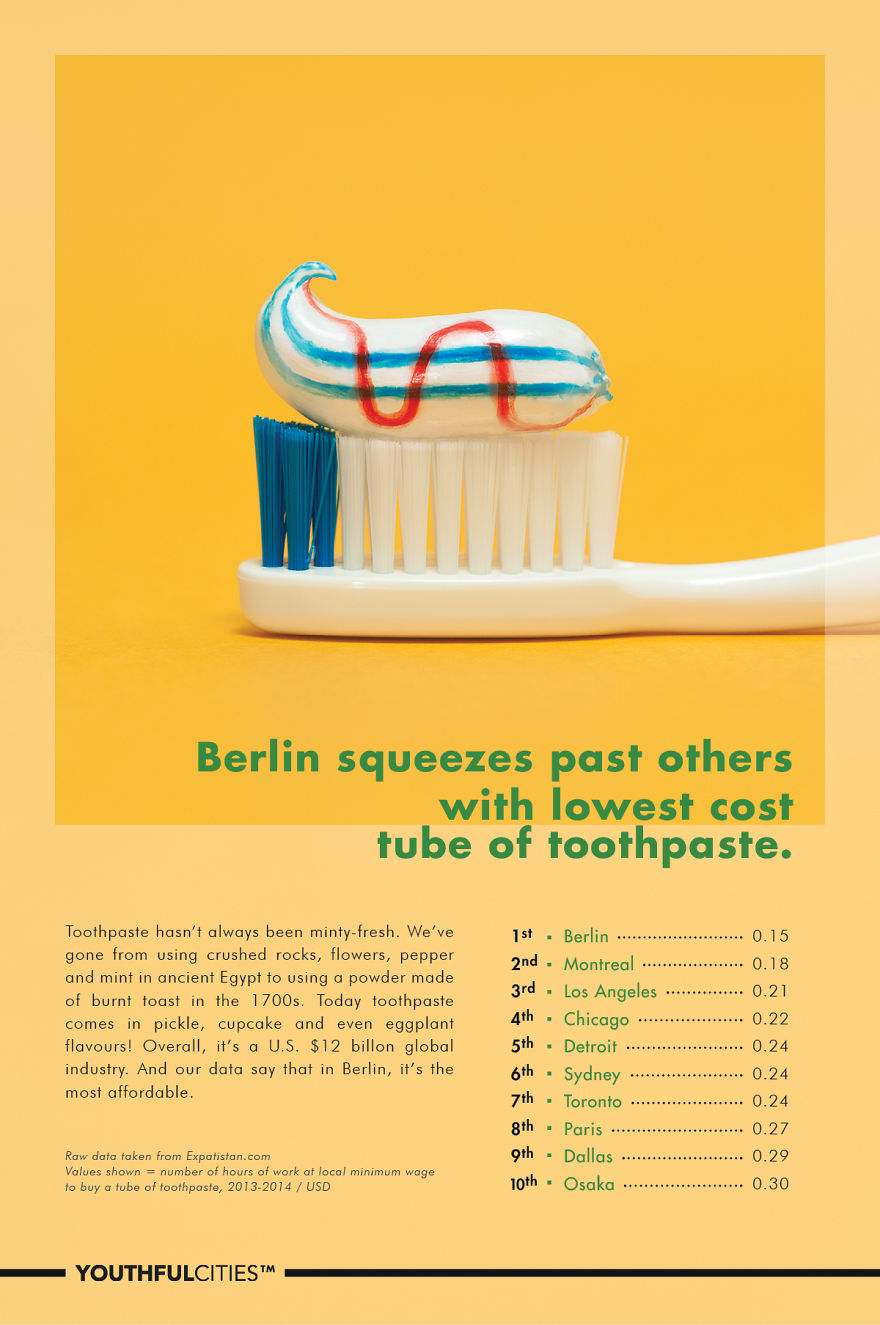
I created these posters using all sorts of objects & tools. I cut out the piggy bank slot from the egg using an X-ACTO knife. I created the toothpaste out of Sculpey and then baked & painted it. I created the tiny “for rent” sign for the Monopoly house using tiny popsicle stick splinters, and then added white thread & paper.
Feel free to check out my website for more of my creative work.
More info: dorotapankowska.com
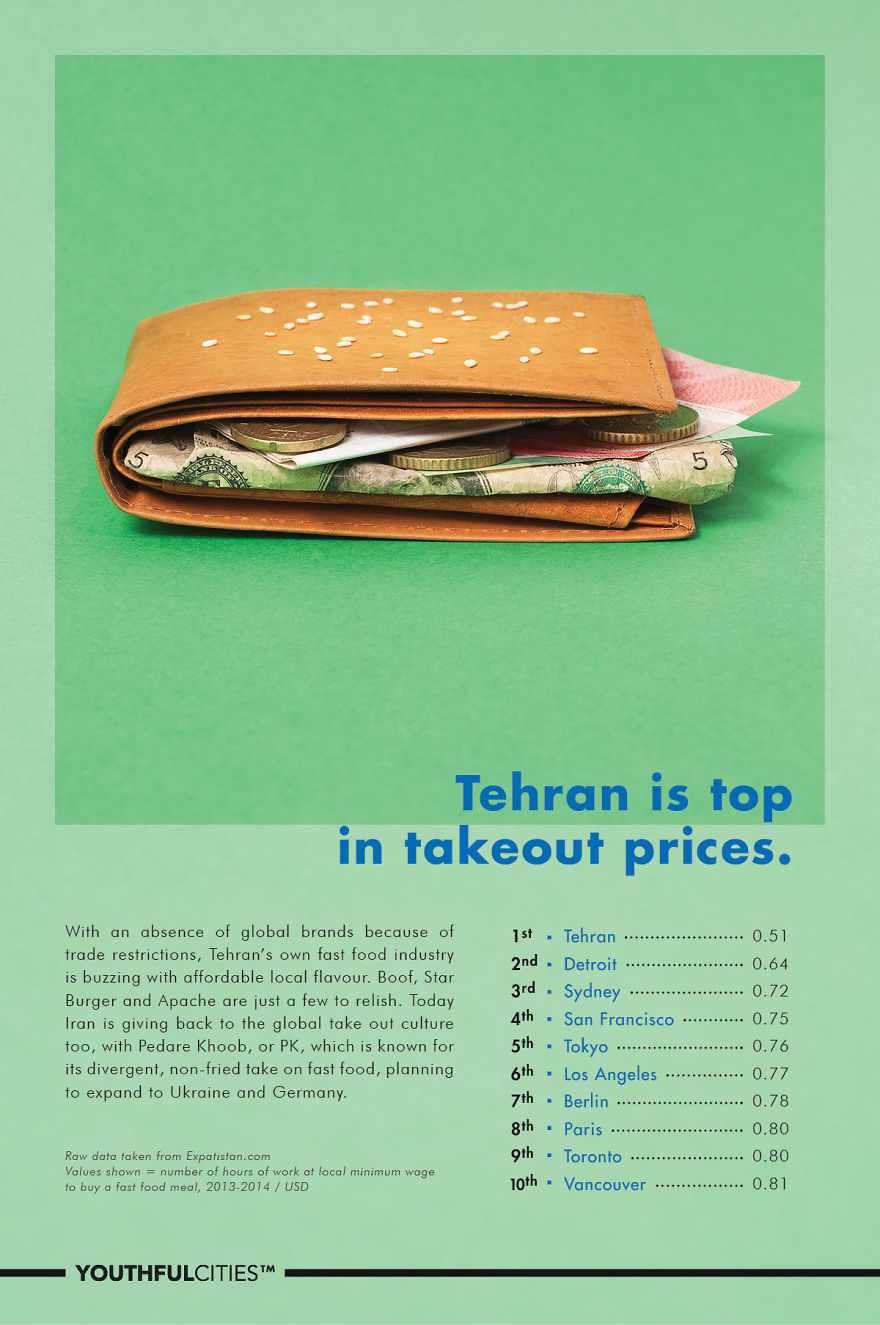
The cost of fast food
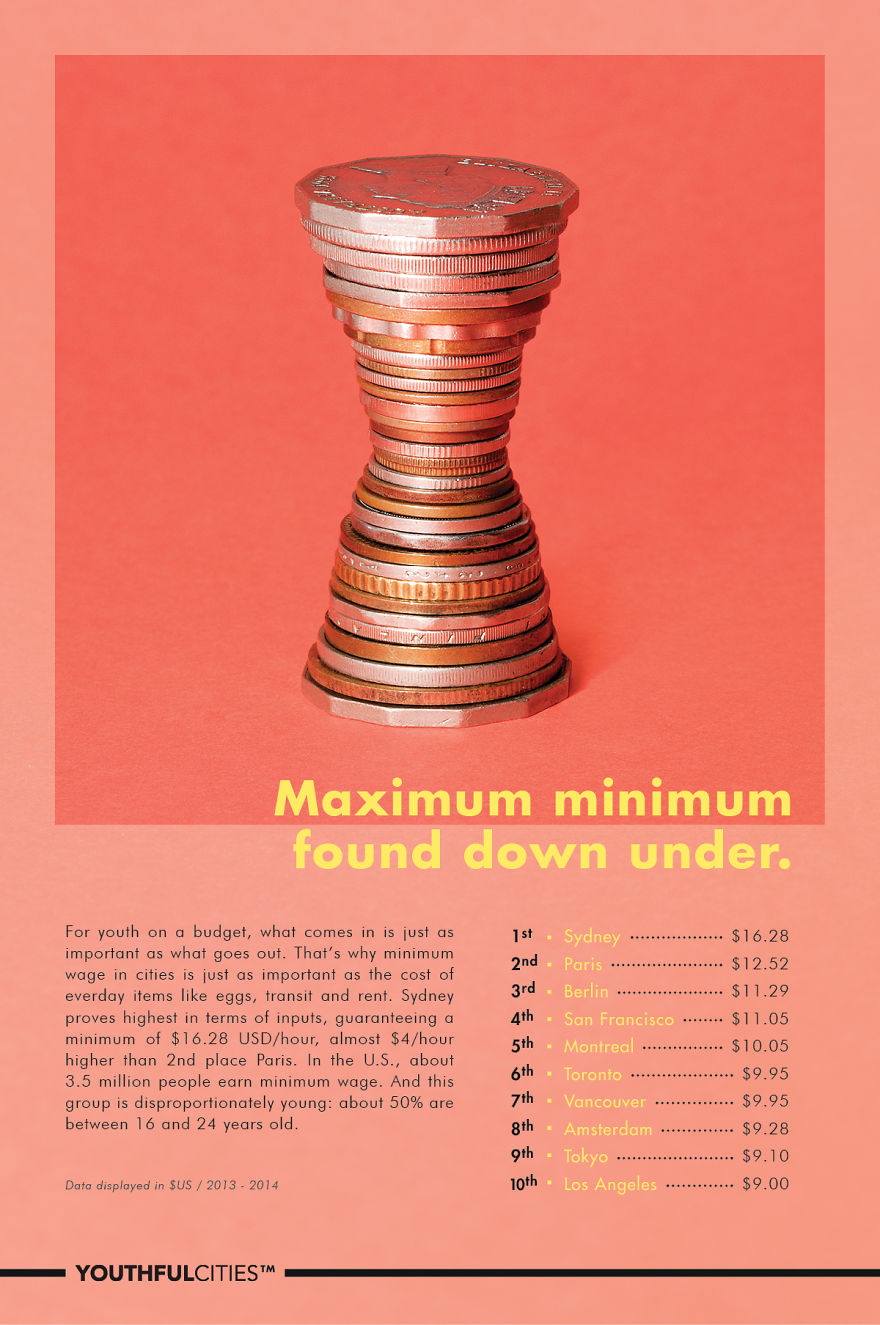
Minimum wage
The cost of a dozen eggs
The cost of a tube of toothpaste
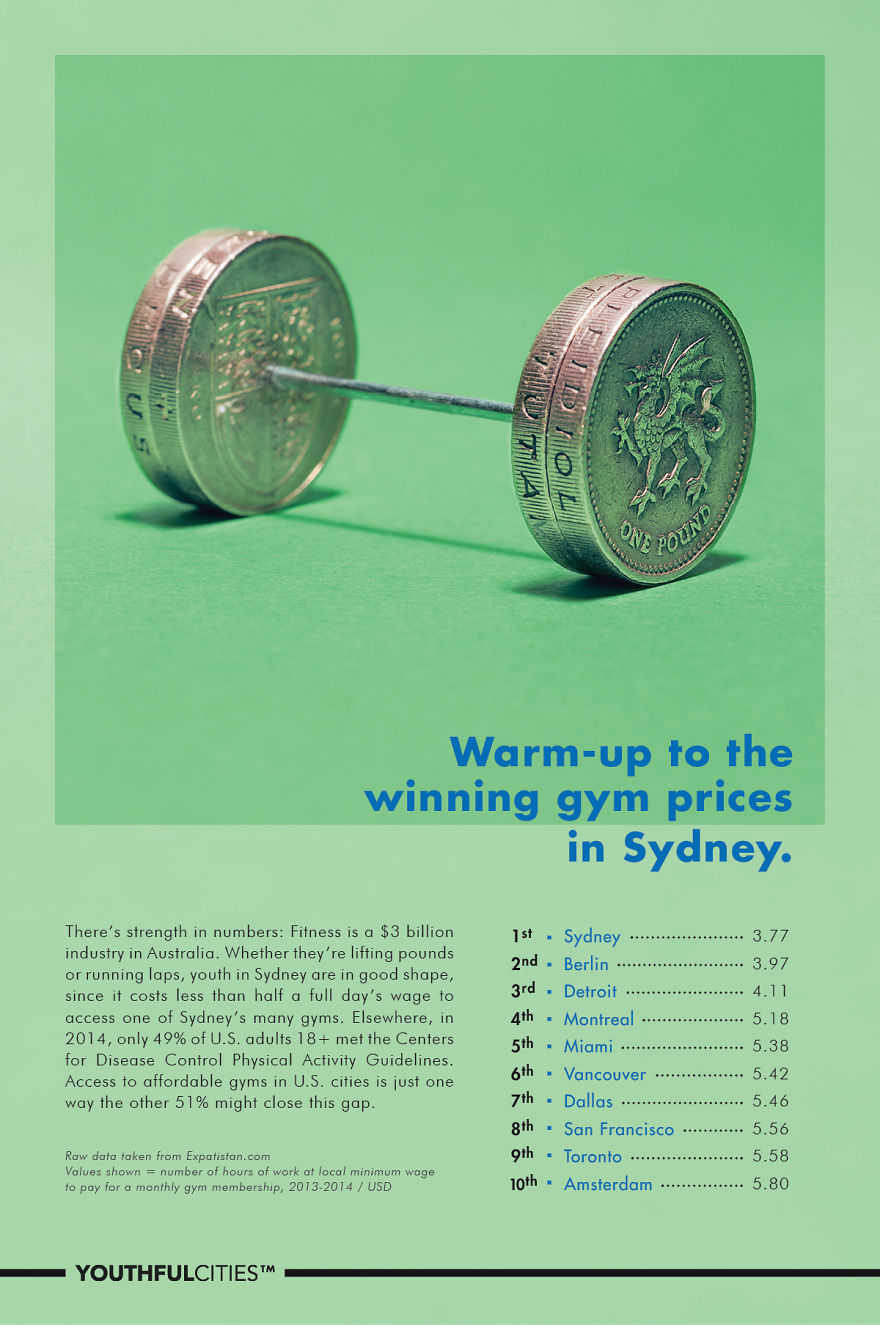
The cost of a monthly gym membership
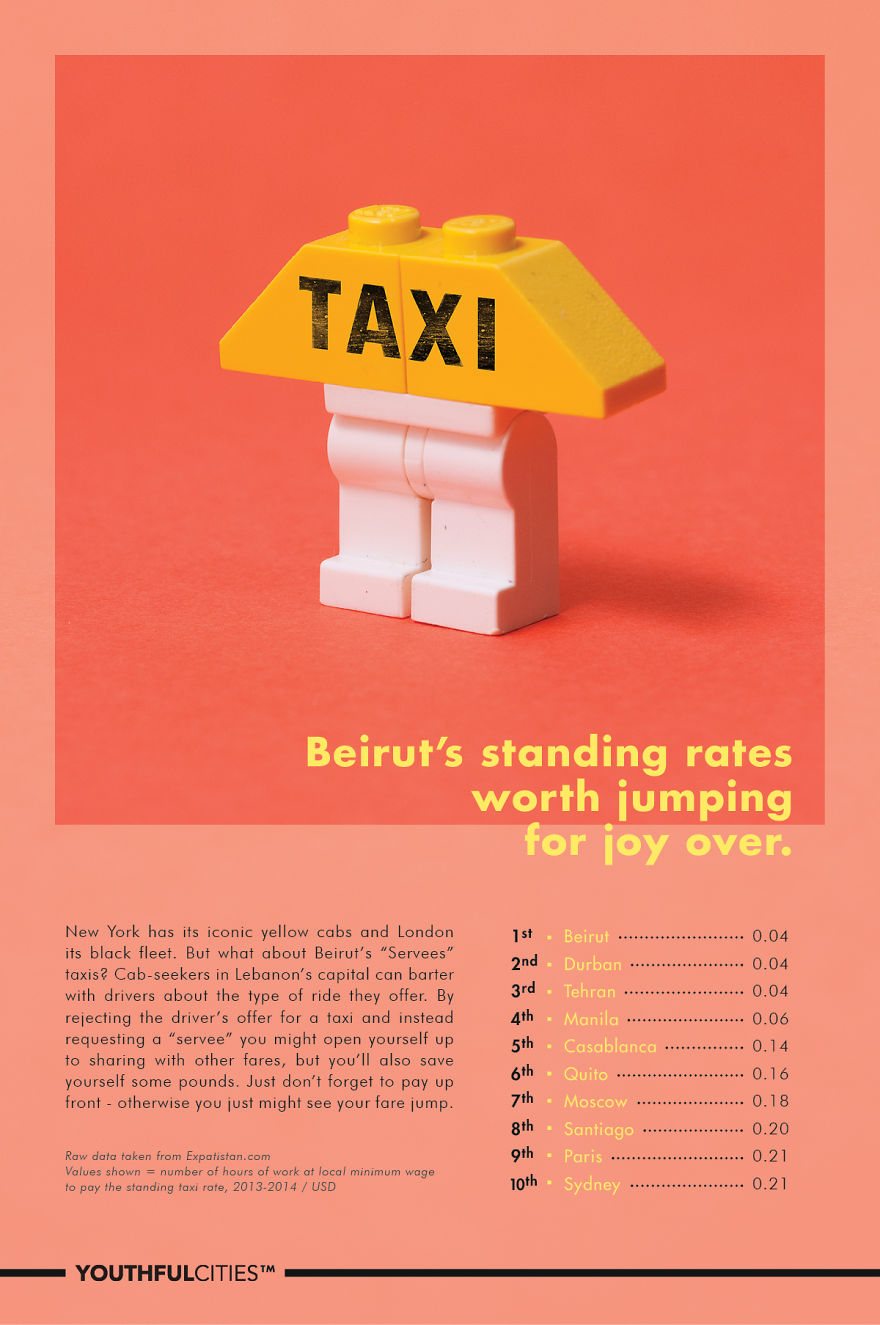
The cost of the standing taxi rate
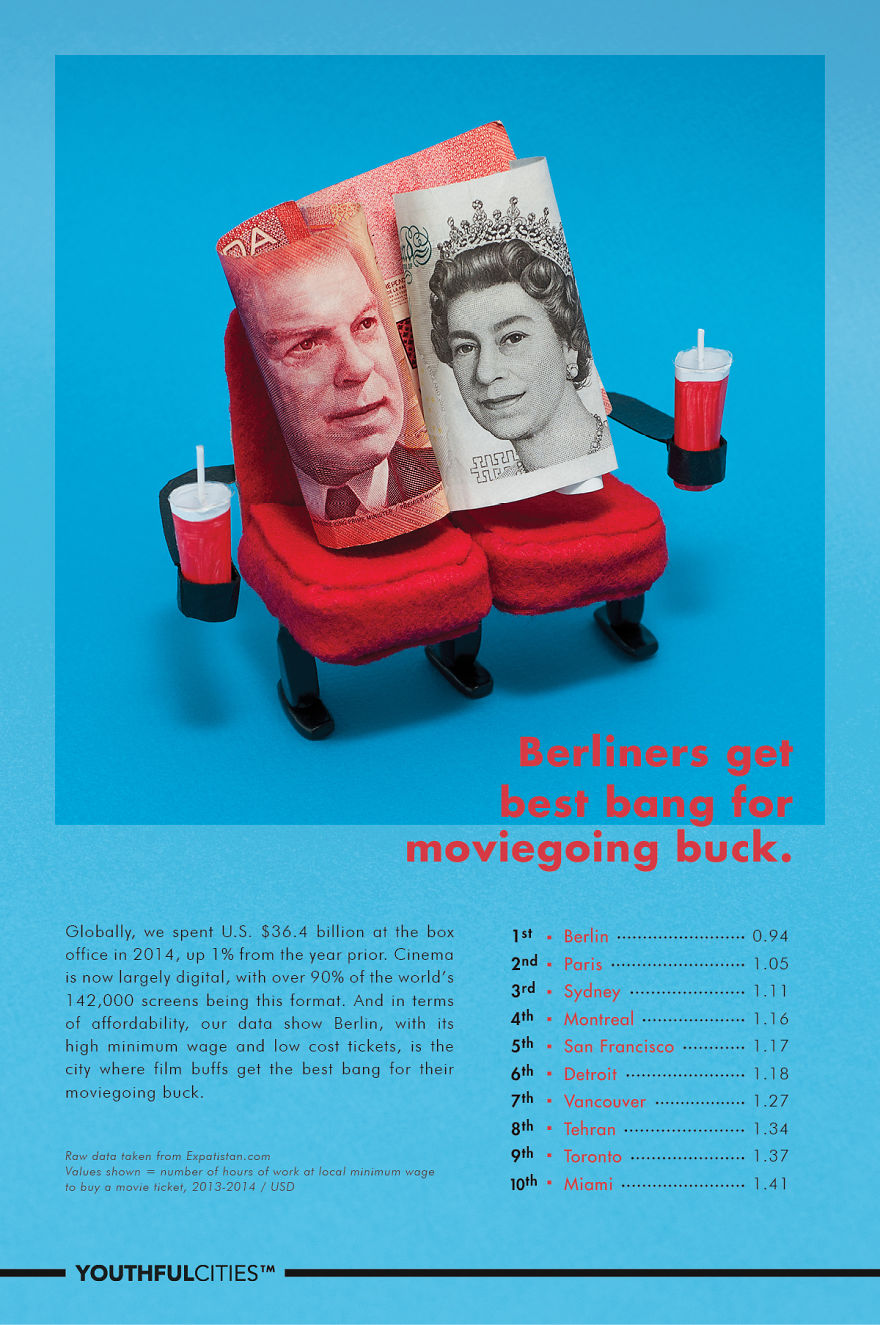
The cost of a movie ticket
The cost of renting an apartment
162views
Share on Facebook
 Dark Mode

 No fees, cancel anytime












5
0